Figure 4.

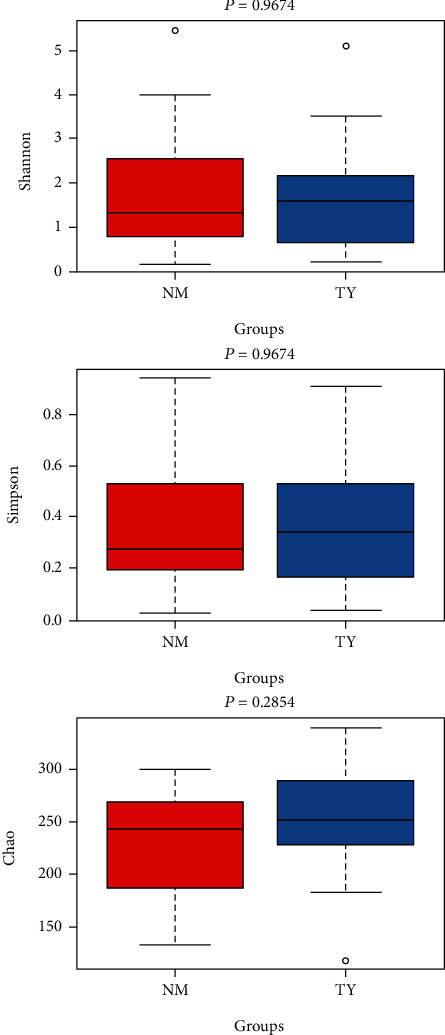
Alpha diversity index and rarefaction curve. Shannon, Simpson, Chao index in embryonic death group and control group. The box plots represent diversity measures and the central line represents the median value.

Alpha diversity index and rarefaction curve. Shannon, Simpson, Chao index in embryonic death group and control group. The box plots represent diversity measures and the central line represents the median value.