
FIGURE 5.
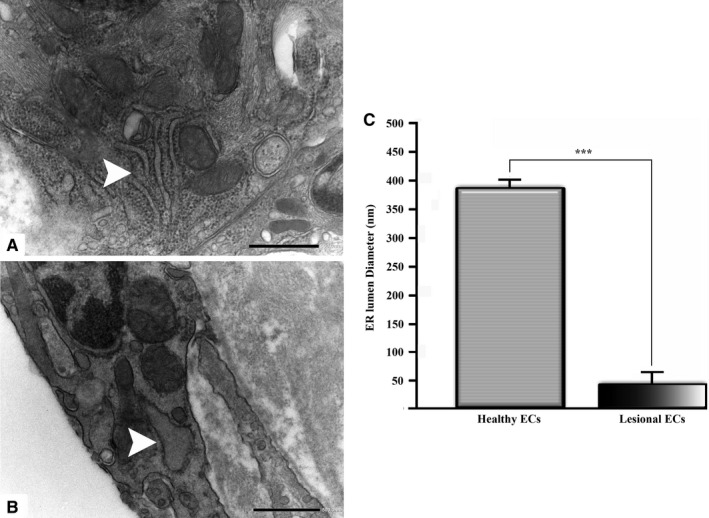
The diameter of the ER lumen has been obtained from EM images and compared between healthy (a) and lesional (b) ECs. Data are presented as mean ± S.E.M. ***denote p < .001 (c). (a, b original magnification ×20000)
Official websites use .gov
A
.gov website belongs to an official
government organization in the United States.
Secure .gov websites use HTTPS
A lock (
) or https:// means you've safely
connected to the .gov website. Share sensitive
information only on official, secure websites.
The diameter of the ER lumen has been obtained from EM images and compared between healthy (a) and lesional (b) ECs. Data are presented as mean ± S.E.M. ***denote p < .001 (c). (a, b original magnification ×20000)