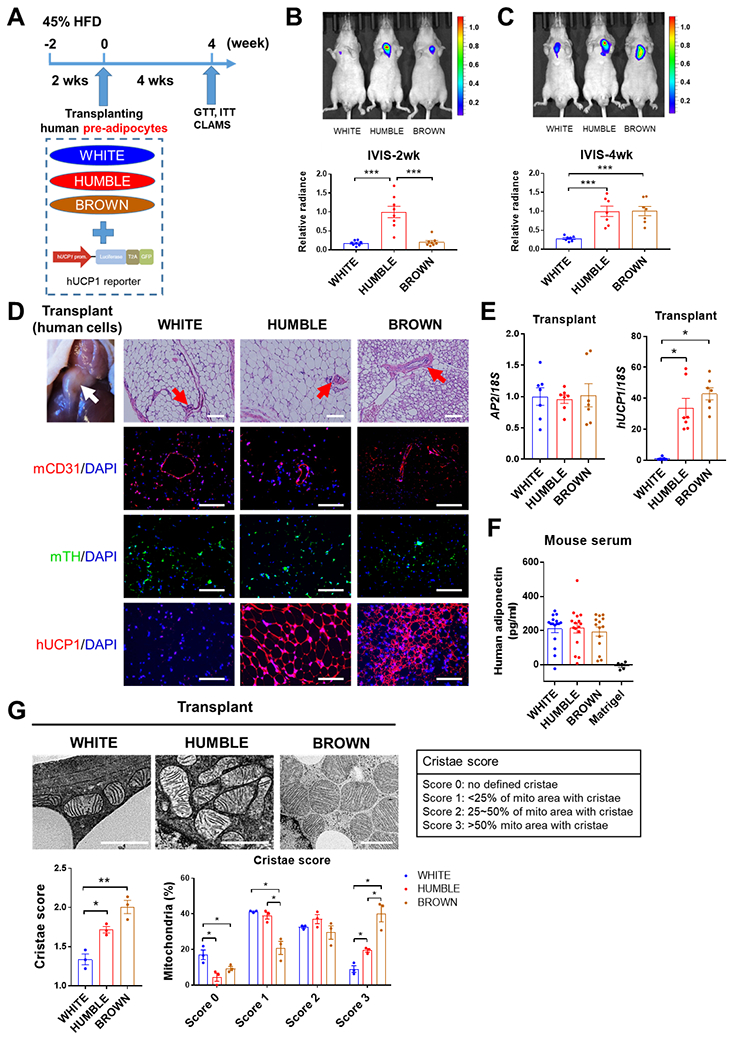
Fig. 2. Transplanted white control, HUMBLE, or brown control cells reconstitute functional adipose tissue in mice.

(A) Protocol schematic for transplantation of white control, HUMBLE, and brown control preadipocytes into nude mice. After mice were fed with 45% HFD for 2 weeks, cells transduced with a UCP1 reporter construct were transplanted into thoracic-sternum region and mice were fed with 45% HFD for a further 4 weeks before a glucose tolerance test (GTT), insulin tolerance test (ITT), and metabolic analysis with the Comprehensive Lab Animal Monitoring System (CLAMS). (B and C) UCP1 promoter activity measured by in vivo bioluminescence imaging in mice 2 weeks (B) and 4 weeks (C) after transplantation with white control, HUMBLE, or brown control cells. A representative image of n=8 experimental animals per group (upper) and quantification of luminescence (bottom) are shown. (D) H&E staining and immunostaining of human cell transplants after dissection from mice 4 weeks after transplantation with either white control, HUMBLE, or brown control cells. Sections were stained for mouse CD31 (mCD31), mouse tyrosine hydroxylase (mTH), and human UCP1 (hUCP1). The white arrow indicates the transplanted fat-like human tissue and the red arrows indicate vascular structures. Representative micrographs with 100 μm scale bars are shown; n = 8 mice per group. (E) Human specific AP2 and UCP1 mRNA expression measured by qPCR in transplanted tissues dissected from mice 4 weeks after receiving white control, HUMBLE, or brown control cells; n = 4 mice per group. (F) Human adiponectin relative abundance in serum of mice 4 weeks after transplantation with Matrigel only or with white control, HUMBLE or brown control cells; n = 5 mice with Matrigel, n=15 mice per cell transplant group. (G) Mitochondrial morphology in transplants assessed by HPF-TEM 4 weeks after transplantation of white control, HUMBLE, and brown control cell. Data are presented as representative micrographs with 1 μm scale bars (left). Mitochondrial cristae in the transplants were assessed based on different criteria (right). Mean cristae scores and percentage of mitochondria with different cristae scores in white control, HUMBLE, and brown control transplants were quantified. For all graphs, data are presented as means ± s.e.m.; *p < 0.05; **p < 0.01; ***p < 0.001.
