Figure 2.

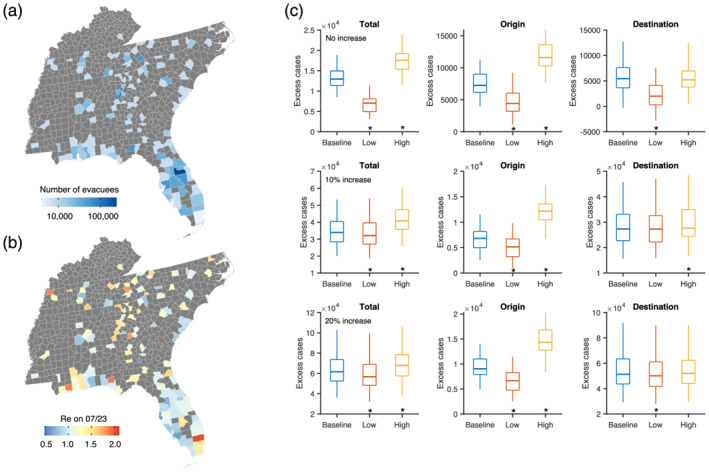
Simulations for evacuation using the national county‐level transmission model. (a) The number of evacuees accepted by destination counties in the baseline scenario in southeast United States. (b) The estimated effective reproductive numbers Re for both origin and destination counties in southeast United States on 23 July 2020. (c) Comparison of excess cases in origin and destination counties combined (left column), only origin counties (middle column) and only destination counties (right column) for the baseline, low and high evacuation scenarios. Simulations were performed for three settings: no increase (top row), 10% increase (middle row), and 20% increase (bottom row) of the transmission rates in destination counties. Box plots show the median and interquartile and whiskers show the 95% CIs. Asterisks indicate that excess cases are significantly lower or higher than the baseline scenario (Wilcoxon signed rank test, p < 10−5). Results are obtained from 100 model simulations; the box and whisker distributions show variations across simulation runs.
