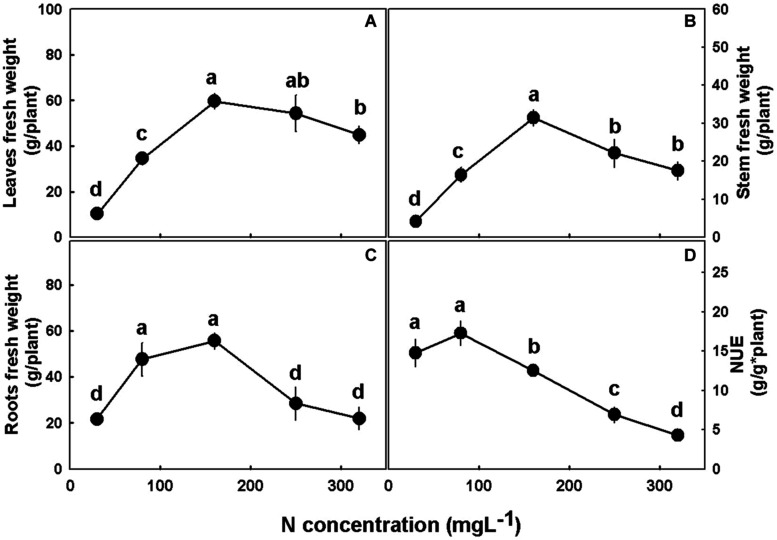
FIGURE 2.
Effect of N nutrition on plant biomass in cannabis plants. Fresh weights of leaves (A), stem (B), and roots (C), and nitrogen use efficiency (NUE) (D). Presented data are averages ± SE (n = 5). Different small letters above the means represent significant differences between treatments by Tukey HSD test at α = 0.05.

