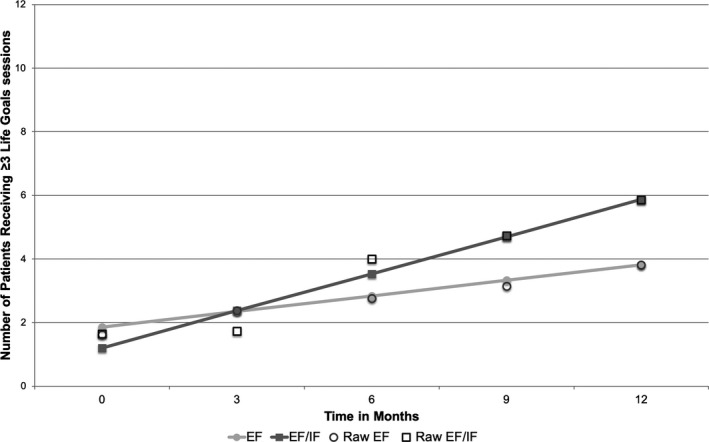
FIGURE 3.

Longitudinal change in site reports of number of patients receiving ≥ 3 Life Goals sessions, by treatment arm (Site N = 43). Note: EF = External Facilitation; EF/IF = External +Internal Facilitation. Site‐level data on patient receipt of Life Goals were reported monthly by each site; predictions and raw data are shown for months 0, 3, 6, 9, and 12 after randomization.
