
FIGURE 1.
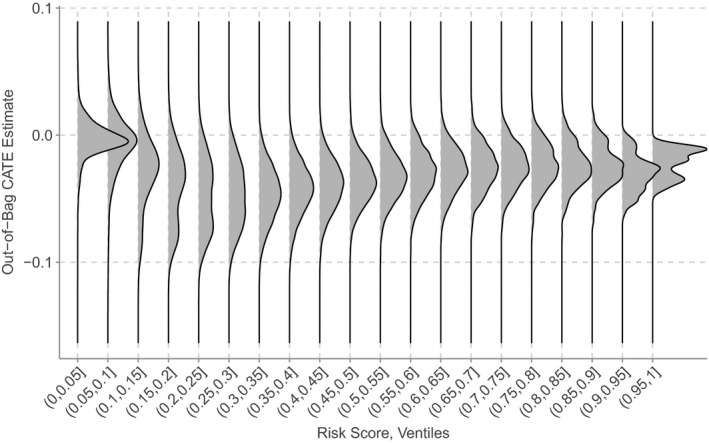
Treatment effect heterogeneity across risk score ventiles. The densities represent the distribution of estimated conditional average treatment effects within each ventile. They are drawn on a common scale, and hence do not reflect the variation in sample size across ventiles. The values in the bracket denote the risk range for that ventile; for example, (0.25, 0.3] represents all patients with predicted risk of 25 to 30%