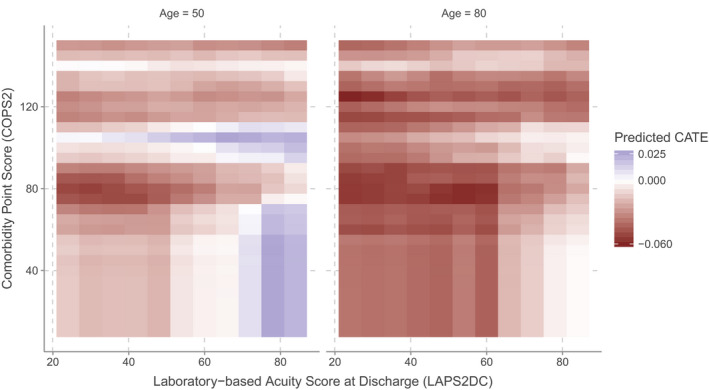
FIGURE 3.

Visualization of the estimated conditional average treatment effect function. This figure presents the estimated CATE function as it varies in the dimensions of Laboratory‐based Acuity Score at discharge (LAPS2DC) and Comorbidity Point Score (COPS2), for a patient with chronic heart failure at ages 50 and 80. Here, we vary LAPS2DC and COPS2 while holding all other continuous covariates at their median values, except for age, which we set to 50 and 80. Categorical covariates were held at their mode, except for the supergroup, which we set to chronic heart failure (CHF). We plot the CATE function from the 10th to 90th percentiles of LAPS2DC and from the 0th to 95th percentiles of COPS2. This is akin to evaluating the CATE function for a set of pseudo‐patients with CHF having these values of COPS2 and LAPS2DC. In this region, the estimated CATE ranged from −0.060 to 0.025 (−6.0% to 2.5%), meaning that the estimated absolute risk reduction of the Transitions Program intervention was as large as −6% for some patients, while for others, their readmission risk was increased by as much as 2.5% [Color figure can be viewed at wileyonlinelibrary.com]
