
Fig. 4.
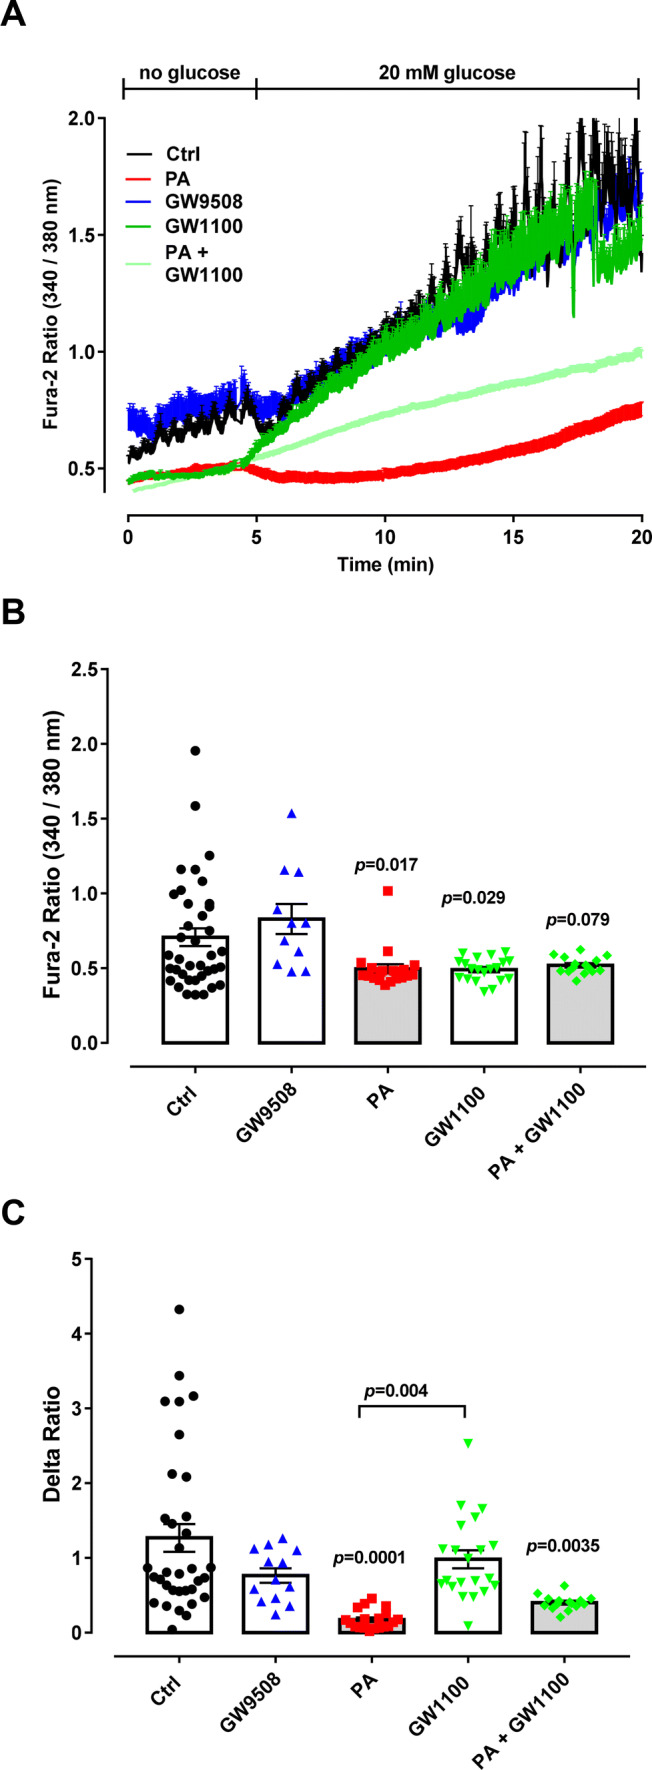
Dynamic measurements of Ca2+ in BRIN-BD11 cells. Cells were divided into: control condition (Ctrl), 100-µM palmitate (PA), 20-μM GPR40 agonist(GW9508), 10-μM GPR40 antagonist (GW1100) and PA + GW1100, treated in 10-mM glucose for 48 h. After the incubation, Ca2+ measurements were performed using Fura-2 AM dye using an Axio Observer seven microscope. Cells were first incubated for 5 min without glucose followed by up to 20 min with 20 mM of glucose. a Calcium dynamics. Glucose concentration is indicated above. Two-way ANOVA followed by Tukey was used to compare Ctrl, PA, GW1100 and PA + GW1100; Student’s t test was used to compare Ctrl and GW9508. b Resting Ca2+ was calculated as an average of the first 5 min of measurement before glucose addition. There was no significant effect of PA (F1,90 = 3.423, p = 0.0676) or GW1100 (F1,90 = 2.399, p = 0.1250). c Delta was calculated by averaging data at 18 min minus the average of data at 4 min. There was a significant effect of PA (F1,87 = 24.89, p < 0.0001) and not GW1100 (F1,87 = 0.0001879, p = 0.9891). Results are expressed as mean ± SEM for three independent experiments. p values are shown on the graph and indicate the difference versus control