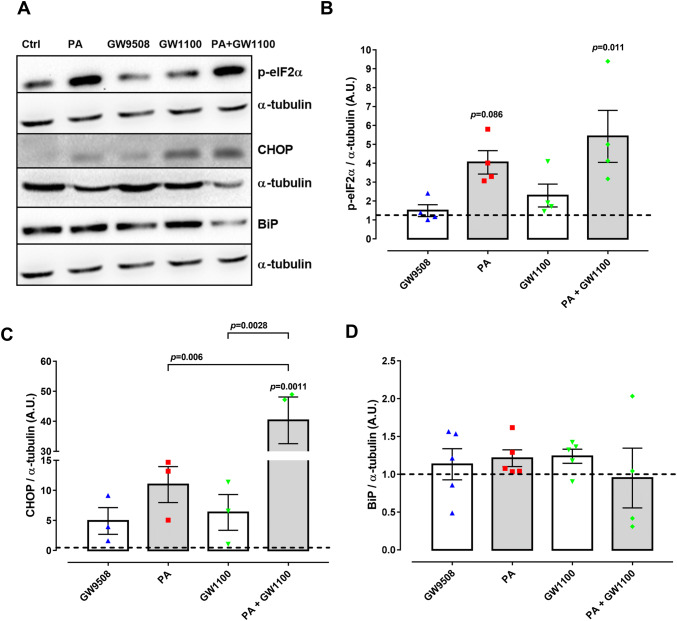
Fig. 5.
Expression of ER stress markers in BRIN-BD11 cells. Cells were divided into: control condition (Ctrl), 100-µM palmitate (PA), 20-μM GPR40 agonist GW9508 (GW9508), 10 μM GPR40 antagonist (GW1100), PA + GW1100 and were treated in media containing 10-mM glucose for 48 h. Western blot analysis was performed for the proteins of interest: p-eIF2α, CHOP and BiP, using α-tubulin as internal control. a Representative bands and respective α-tubulin. Densitometric analysis of western blot: p-eIF2α (b), CHOP (c) and BiP (d). Results are expressed as mean ± SEM of 3–5 independent experiments. Two-way ANOVA followed by Tukey was used to compare Ctrl, PA, GW1100 and PA + GW1100; Student’s t test was used to compare Ctrl and GW9508. b There was a significant effect of PA (F1,12 = 14.41, p = 0.0025) and not GW1100 (F1,12 = 2.691, p = 0.1269). c There was a significant effect of PA (F1,8 = 24.68, p = 0.0011) and GW1100 (F1,8 = 15.35, p = 0.0044). d There was no significant effect of PA (F1,15 = 0.04331, p = 0.8379) or GW1100 (F1,15 = 0.004461, p = 0.9476). p values are shown on the graph and indicate the difference versus control or difference versus PA in brackets

