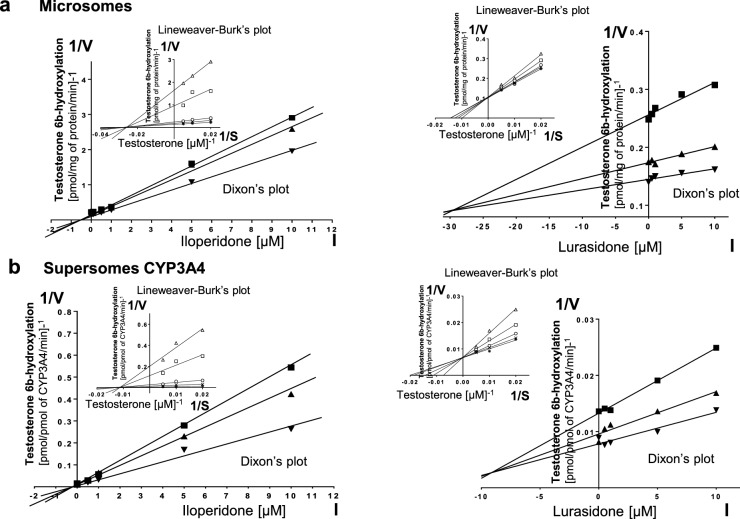
Fig. 5.
The influence of iloperidone or lurasidone on the activity of CYP3A4 measured as a rate of testosterone 6β-hydroxylation. a Human liver (iloperidone: Km = 31.19 µM, Vmax = 7.51 pmol/mg protein/min; lurasidone: Km = 85.01 µM, Vmax = 11.21 pmol/mg protein/min). b Human cDNA-expressed CYP3A4 (supersomes CYP3A4) (iloperidone: Km = 78.7 µM, Vmax = 176.3 pmol/mg protein/min; lurasidone: Km = 58.83 µM, Vmax = 155.1 pmol/mg protein/min). Each point represents the mean value of two independent analyses. V velocity of the reaction, I the concentration of the inhibitor (iloperidone or lurasidone), S the concentration of the substrate (testosterone). The Ki values and mechanisms of inhibition are shown in Table 1. Dixon’s plots (the main plots): the testosterone concentration of 50 µM (filled square), 100 µM (filled upward triangle) and 200 µM (filled downward triangle). Lineweaver–Burk’s plots (inserts): control—no inhibitor (no iloperidone or lurasidone) (asterisk); the inhibitor (iloperidone or lurasidone) concentration of 0.5 µM (cross mark), 1 µM (unfilled circle), 5 µM (unfilled square) and 10 µM (unfilled upward triangle)

