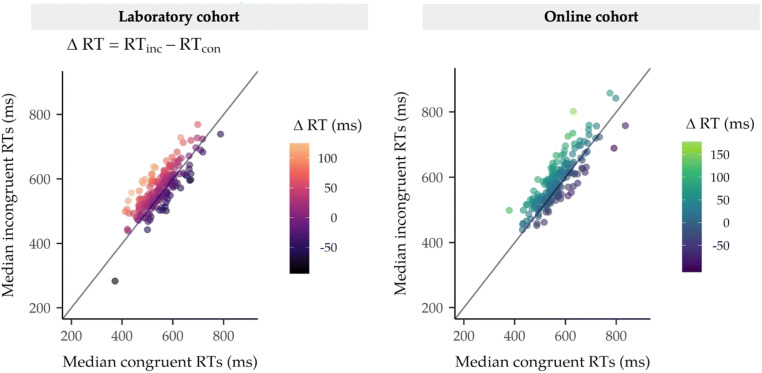
Fig. 5.
Plots showing the observed reaction time priming effects for non-food primes in the laboratory and online cohorts. The scatterplots show the individual median reaction times (RTs) calculated for non-food prime trials at the participant level and how they differ for each level of affective congruence. As expected, participants were faster to respond on congruent compared with incongruent trials (H1a) in both the laboratory and online cohorts. The RT priming effect (∆RT) was calculated as the difference between incongruent and congruent RTs (RTinc − RTcon). Any value shown above the unity line on these plots corresponds to a positive priming effect, whereby incongruent RTs (y-axis) are larger compared with congruent RTs (x-axis). The magnitude of ∆RT (ms) can be visualized using the colour gradient applied to plotted data points

