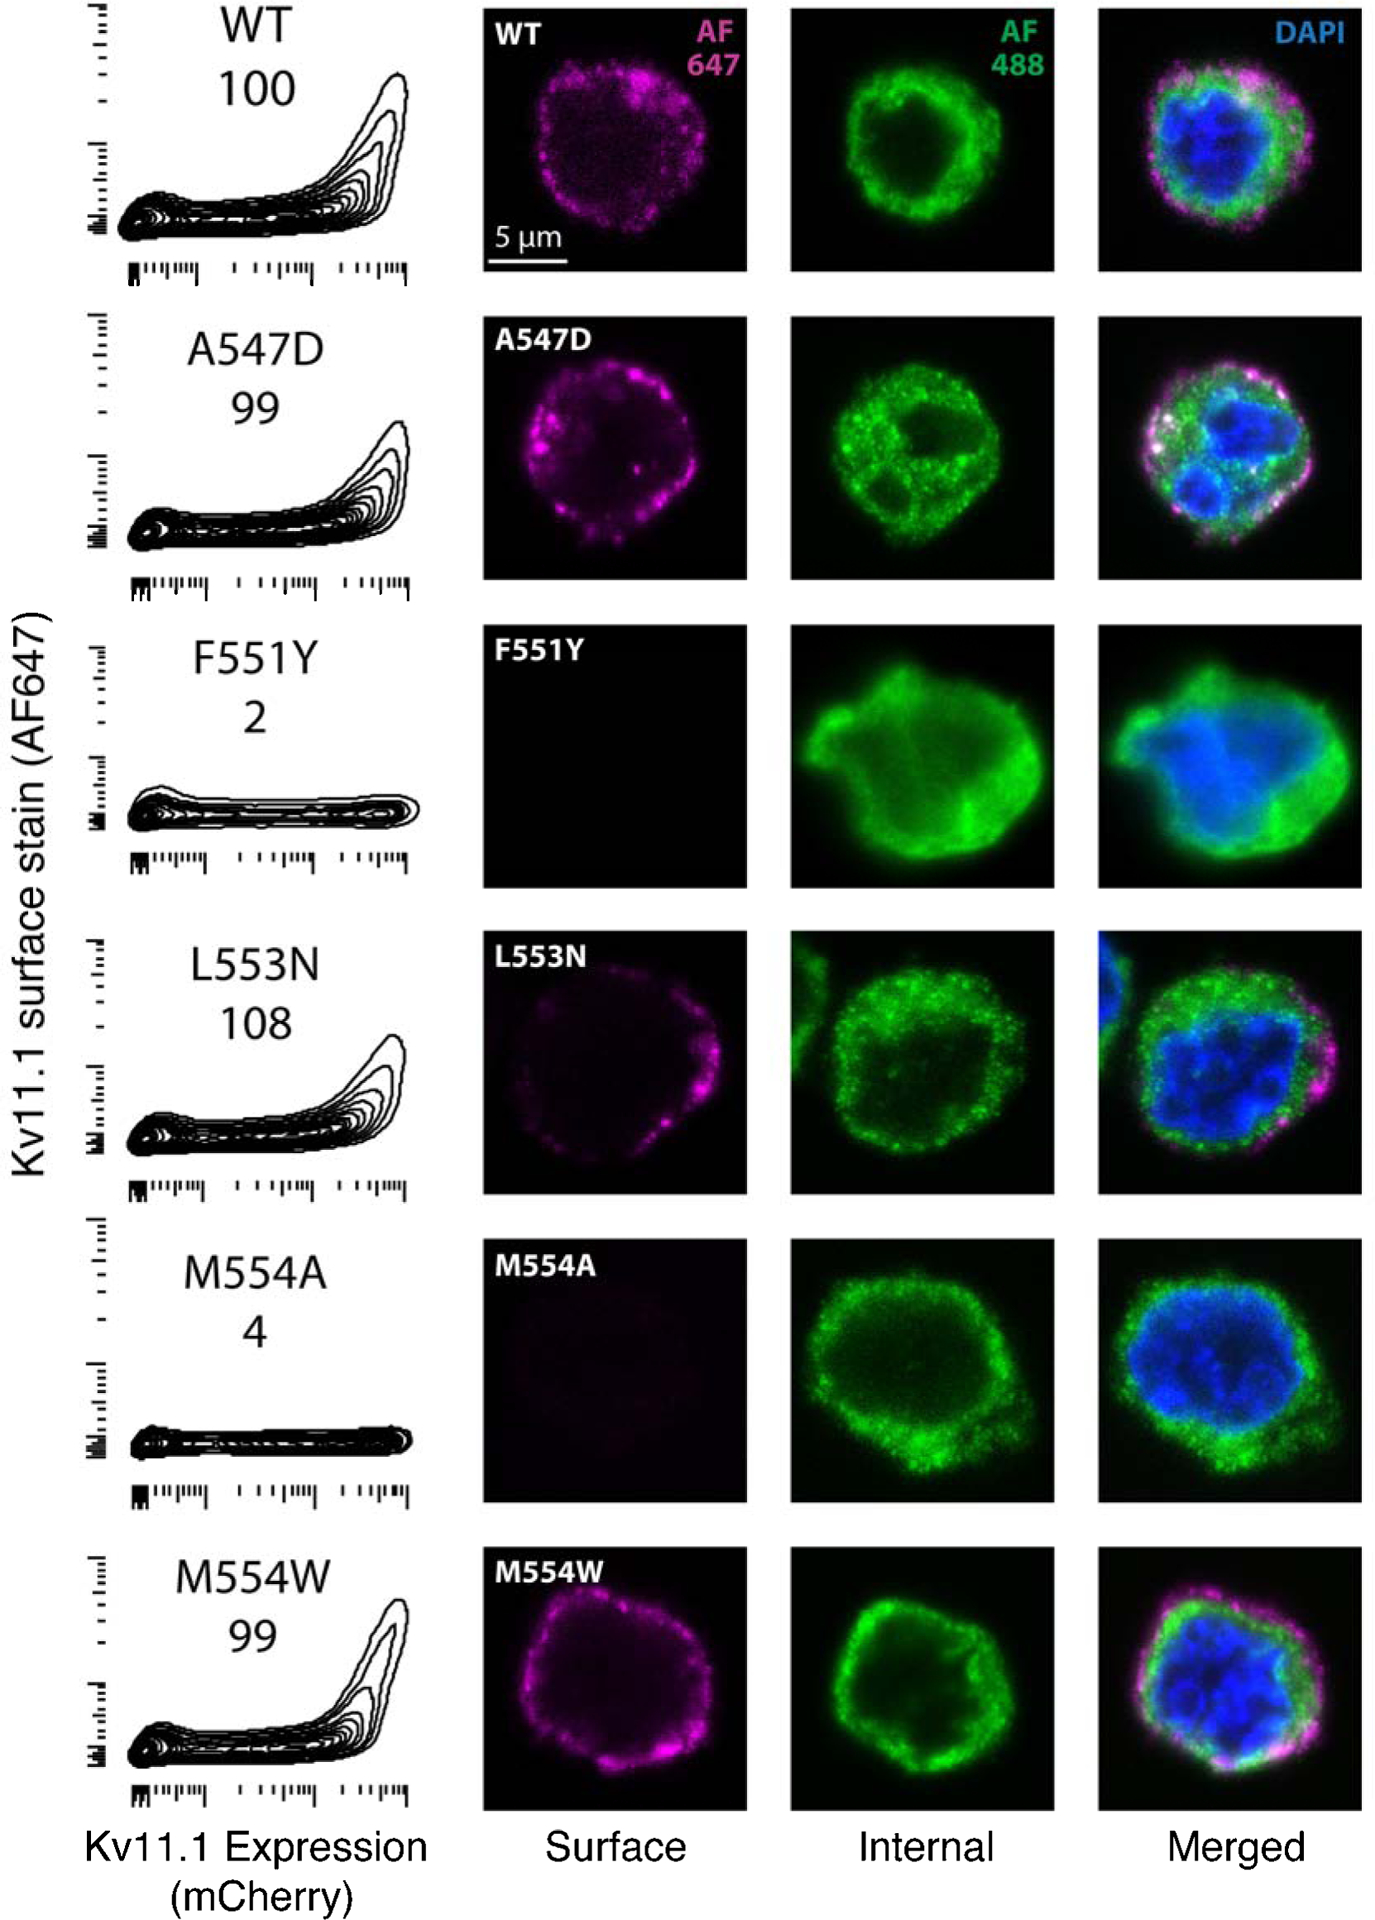
Figure 5: Validation of trafficking scores.

Validation of selected variants by analytical flow cytometry (left) and confocal microscopy (right). In the leftmost column, DMS score is indicated directly below variant name. X-axis is mCherry fluorescence (indicating KV11.1 expression), the y-axis is surface stained KV11.1. The remaining columns are extracellularly stained KV11.1 (AF647, purple) intracellularly stained KV11.1 (AF488, green), and both merged with DAPI stained nucleus (blue).
