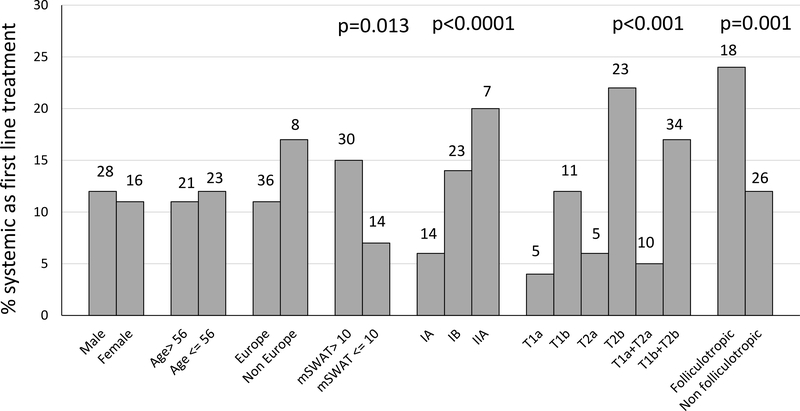
Figure 2.
Clinico-pathologic characteristics associated with first systemic approach. Bars represents percentage values of patients treated with a first systemic approach according to the different clinic-pathologic characteristics. Numbers at the top of each bar represent absolute numbers of patients. P values of parameters with a statistically significant difference are reported at the top of the graph.

