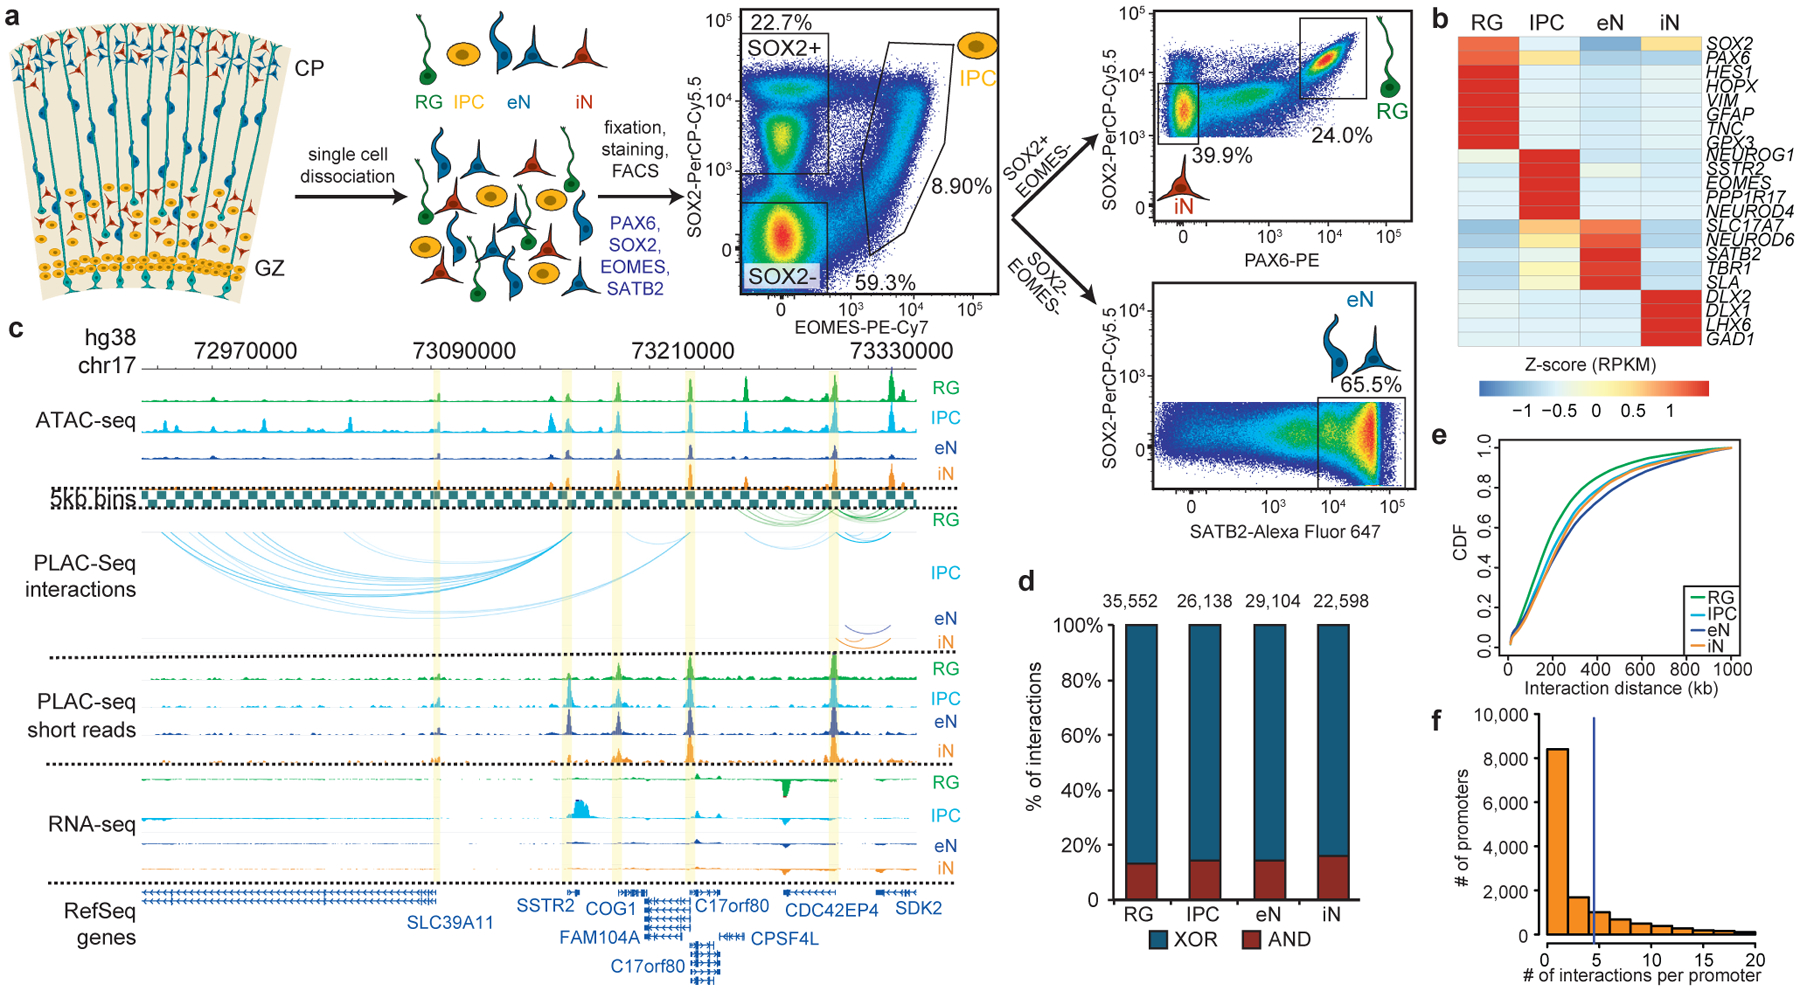
Figure 1. Experimental design and features of 3D epigenomes during human corticogenesis.

(a) Schematic of the sorting strategy. Microdissected GZ and CP samples were dissociated into single cells prior to being fixed, stained with antibodies for PAX6, SOX2, EOMES, and SATB2, and sorted using FACS. (b) Heatmap displaying the expression of key marker genes for each cell type. (c) WashU Epigenome Browser snapshot displaying a region (chr17: 72,970,000–73,330,000) with interactions linked to SSTR2 expression in IPCs. (d) Bar graph of interaction counts for each cell type, with the proportions of anchor to anchor (red) and anchor to non-anchor (blue) interactions highlighted. (e) Cumulative distribution function (CDF) plots of interaction distances for each cell type. (f) Histogram displaying the numbers of interactions for interacting promoters across all cell types.
