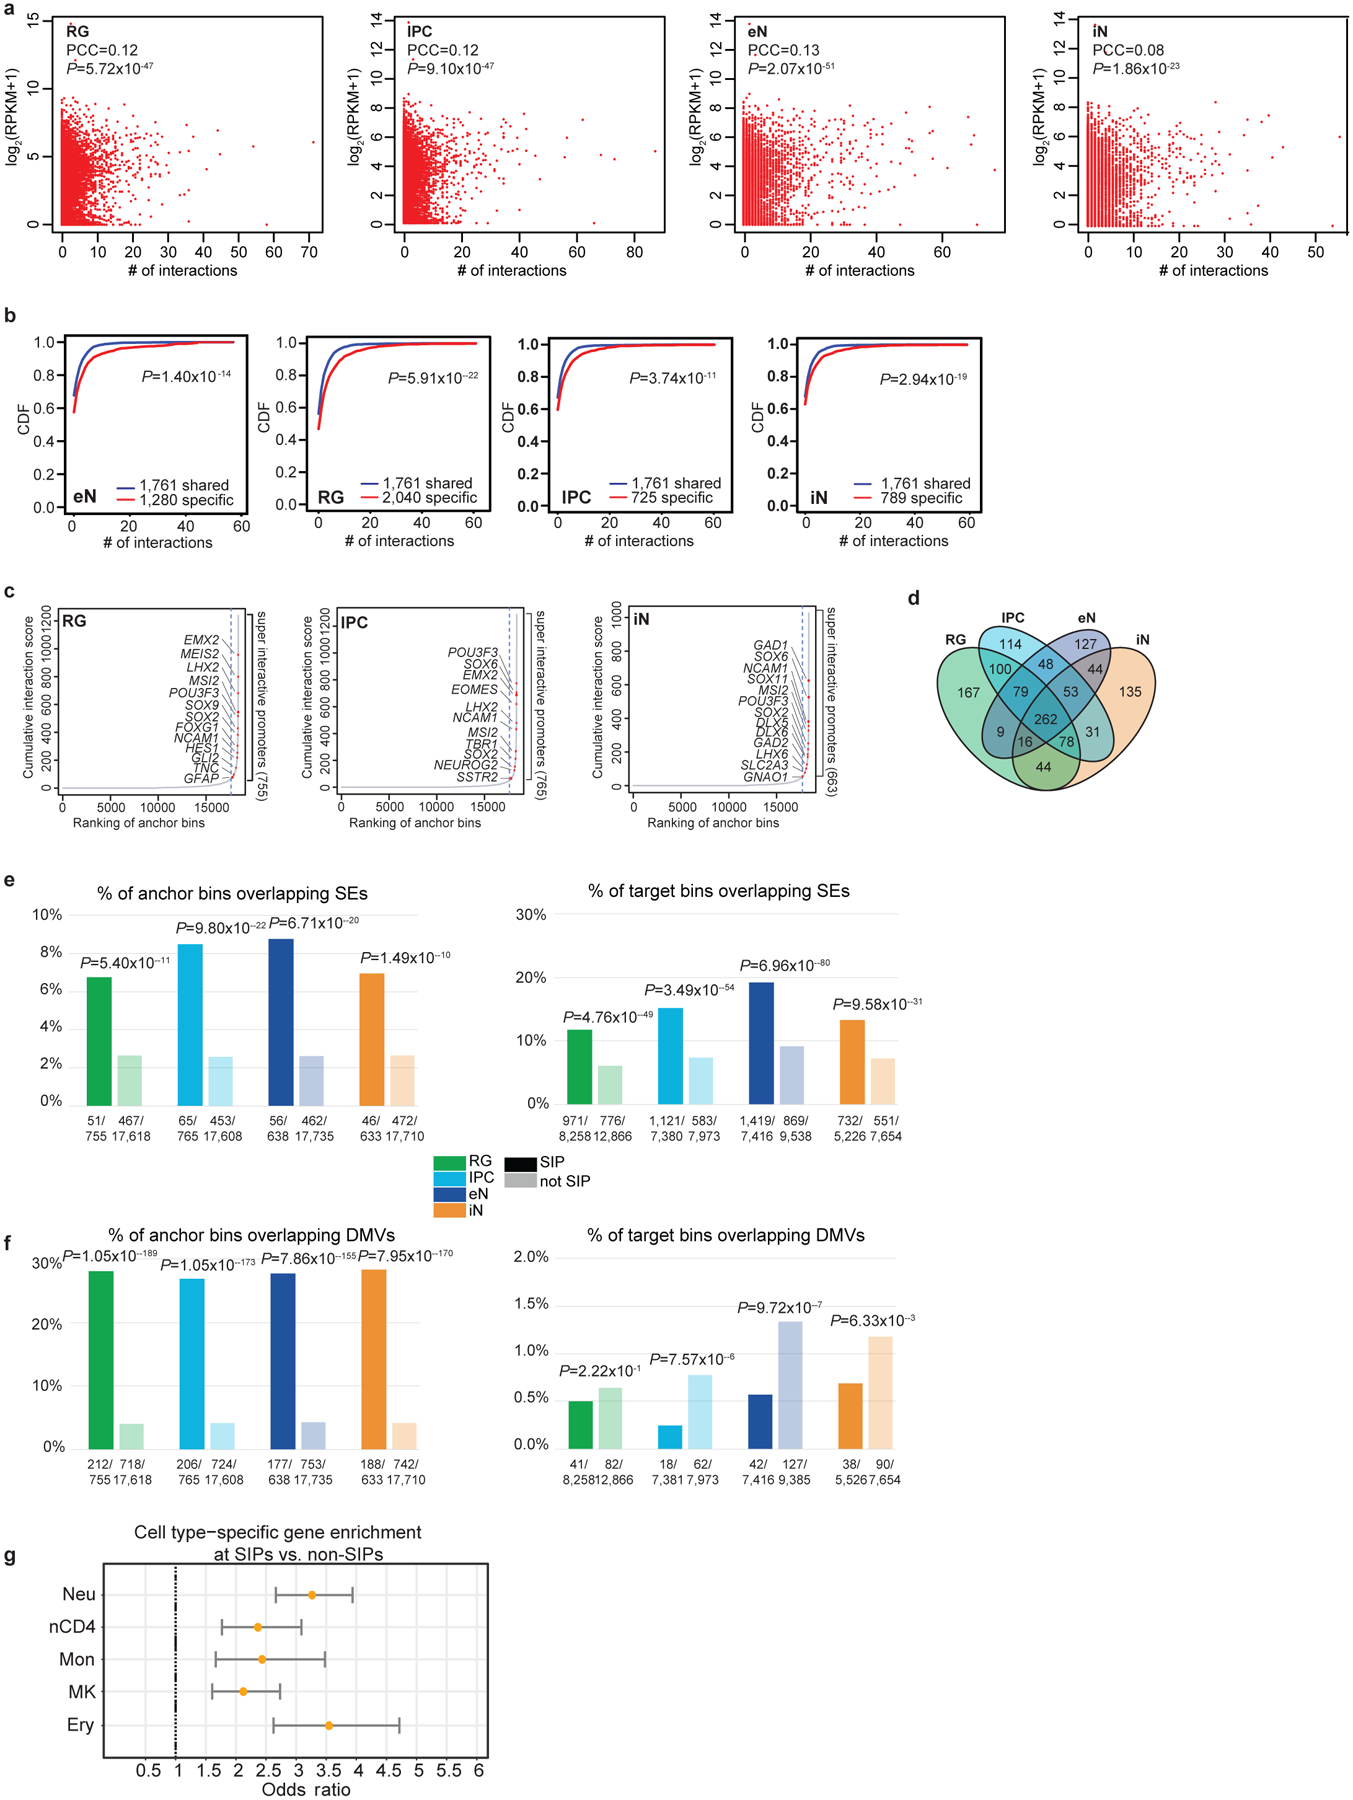
Extended Data Figure 5. Super interactive promoters are enriched for lineage-specific genes.

(a) Scatterplots showing the correlation between interaction counts and gene expression at promoters for each cell type (Pearson product-moment correlation coefficient, two-tailed, n = 13,996 anchor bins with promoters). (b) CDF plots of the numbers of interactions for shared versus cell type-specific genes for each cell type (two-sample t-test, two-tailed). (c) Anchor bins were ranked according to their cumulative interaction scores in RG, IPCs, and iNs. Super interactive promoters (SIPs) are located past the point in each curve where the slope is equal to 1. (d) Venn diagram displaying cell type-specificity for SIPs in each cell type. (e-f) Enrichment of super-enhancers and DMVs at SIPs versus non-SIPs (left) and distal interacting regions for SIPs versus non-SIPs (right) (Fisher’s exact test, two-tailed). Super-enhancers were based on data in the fetal brain and adult cortex, while DMVs were based on data in 40 and 60 day cerebral organoids with closely matched gene expression profiles to mid-fetal cortex samples. (g) Forrest plot showing that SIPs identified in hematopoietic cells are analogously enriched for cell type-specific over shared genes. Odds ratios and 95% confidence intervals are shown. We identified 554, 709, 460, 712, and 401 SIPs in neutrophils, naive CD4+ T cells, monocytes, megakaryocytes, and erythroblasts, respectively.
