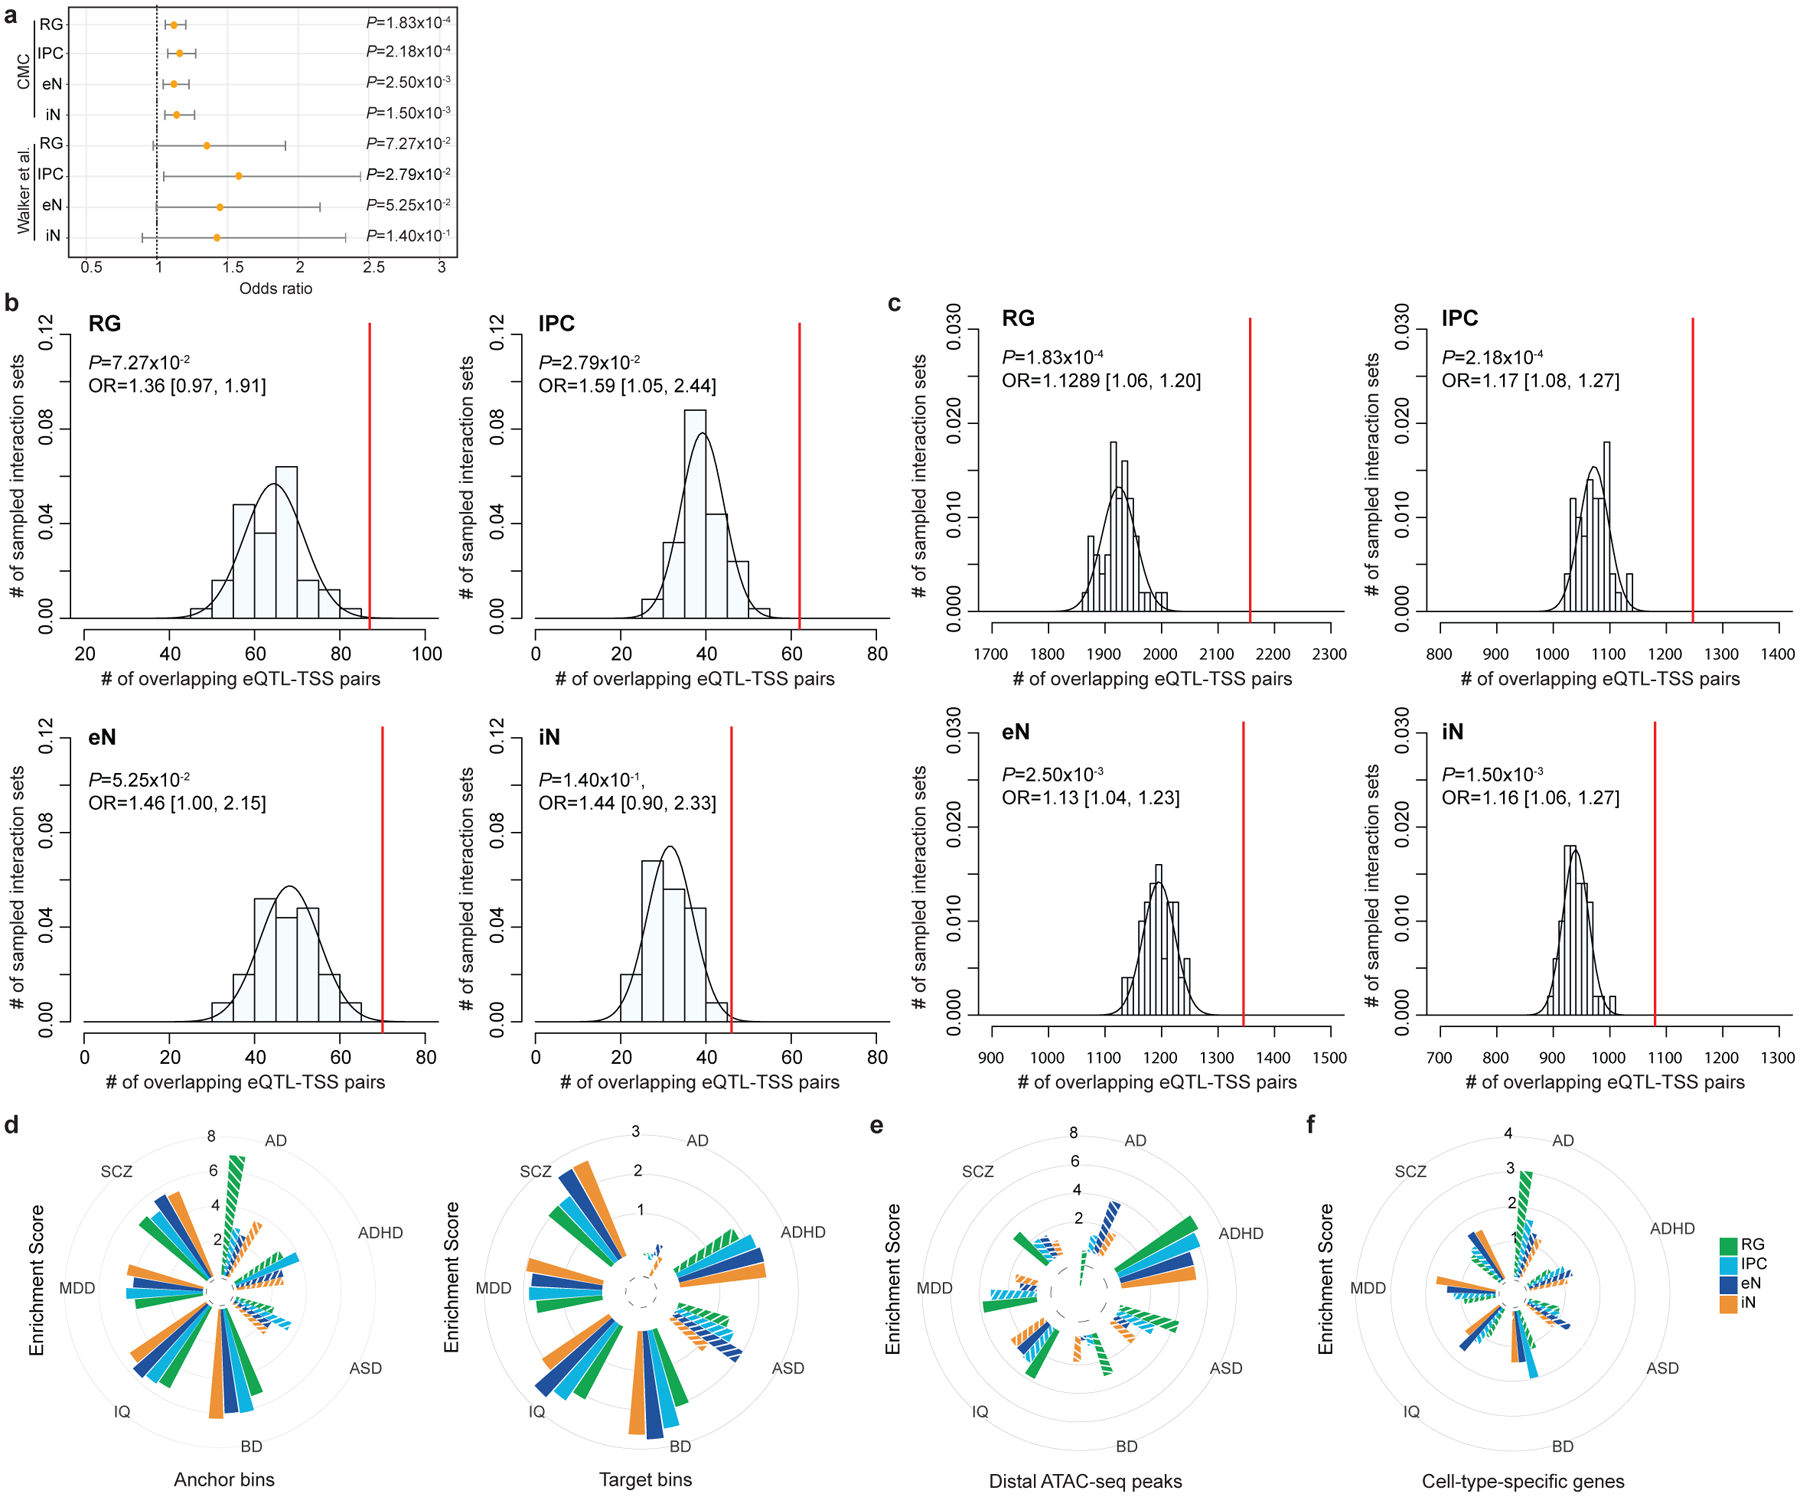
Extended Data Figure 8. Partitioning SNP heritability for complex disorders and traits using alternative epigenomic annotations.

(a) Forrest plot showing the enrichment of fetal and adult brain eQTL-TSS pairs in our interactions compared to n = 50 sets of distance-matched control interactions (Fisher’s exact test, two-tailed). Odds ratios and 95% confidence intervals are shown. The increased significance of adult brain eQTLs can be attributed to the larger sample size of the CommonMind Consortium (CMC) study (n = 1,332,863), while larger odds ratios were observed for the more closely matched fetal brain eQTLs (n = 6,446). (b-c) Histograms displaying the numbers of adult and fetal brain eQTL-TSS pairs recapitulated by n = 50 sets of distance-matched control interactions in each cell type. The numbers of Eqtl-TSS pairs recapitulated by our interactions are indicated by red lines (Fisher’s exact test, two-tailed). (d) LDSC enrichment scores for each disease and cell type, conditioned on the baseline model from Gazal et al. 2017 and stratified by PLAC-seq anchor and target bins. Non-significant enrichment scores are shown as striped bars. (e-f) LDSC enrichment scores for each disease and cell type, conditioned on the baseline model from Gazal et al. 2017 and using either distal open chromatin peaks (e) or cell type-specific genes (f). Non-significant enrichment scores are shown as striped bars.
