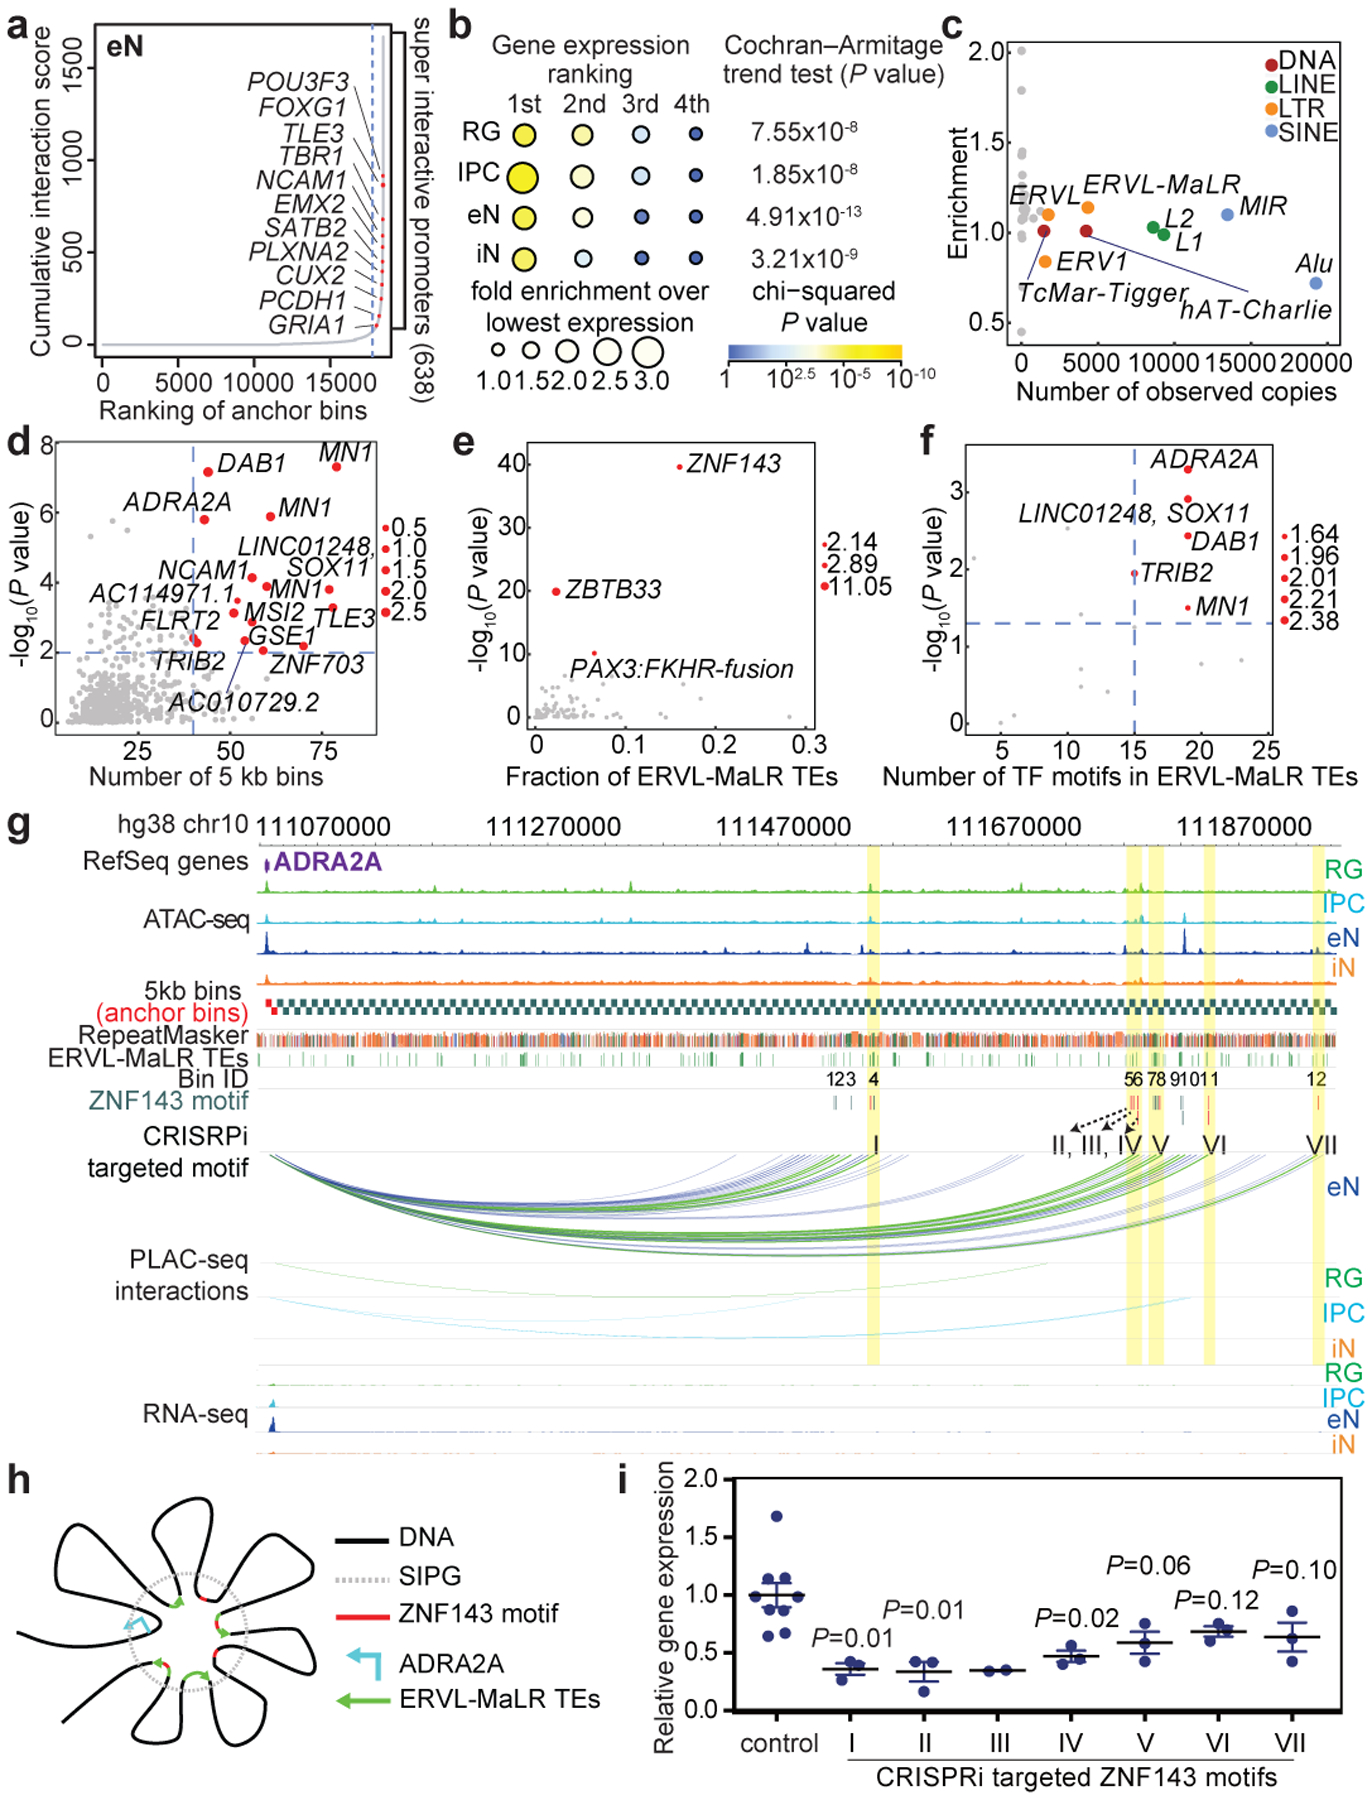
Figure 3. Super interactive promoters are enriched for lineage-specific genes.

(a) Anchor bins were ranked according to their cumulative interaction scores in eNs. Super interactive promoters (SIPs) are located past the point in each curve where the slope is equal to 1. (b) The number of SIPs was divided by the total number of anchor bins (both SIPs and non-SIPs) associated with genes with the 1st, 2nd, 3rd, and 4th highest expression among all four cell types (n = 13,996 anchor bins with promoters). Fold enrichment was calculated relative to the group with the lowest expression among all four cell types. (c) Scatterplot showing the enrichment and numbers of observed copies for TE families in SIPGs for eNs. TE families occupying more than 1% of the genome are colored. (d) Scatterplot showing the enrichment and numbers of distal interacting regions for ERVL-MaLR TEs in SIPGs for eNs (n = 638 SIPGs). The 16 SIPGs with significant enrichment (hypergeometric test, one-tailed, P < 0.01) and 40 or more distal interacting regions are highlighted. (e) Scatterplot showing the enrichment of TF motifs in ERVL-MaLR TEs for the 16 SIPGs highlighted in (d). Enrichment P values are from HOMER. (f) Scatterplot showing the enrichment of ZNF143 motifs in ERVL-MaLR TEs for the 16 SIPGs highlighted in (d) (Poisson distribution, see methods). (g) Interactions between the ADRA2A promoter and 12 distal interacting regions containing ERVL-MaLR TE-localized ZNF143 motifs. (h) Proposed mechanism for the contribution of TEs to SIP formation. (i) ADRA2A expression was significantly downregulated for 3 of 7 regions relative to control sgRNAs (two-sample t-test, two-tailed, P < 0.05, n = 3 for all regions except region III, which has n = 2). Means are indicated and error bars represent the SEM.
