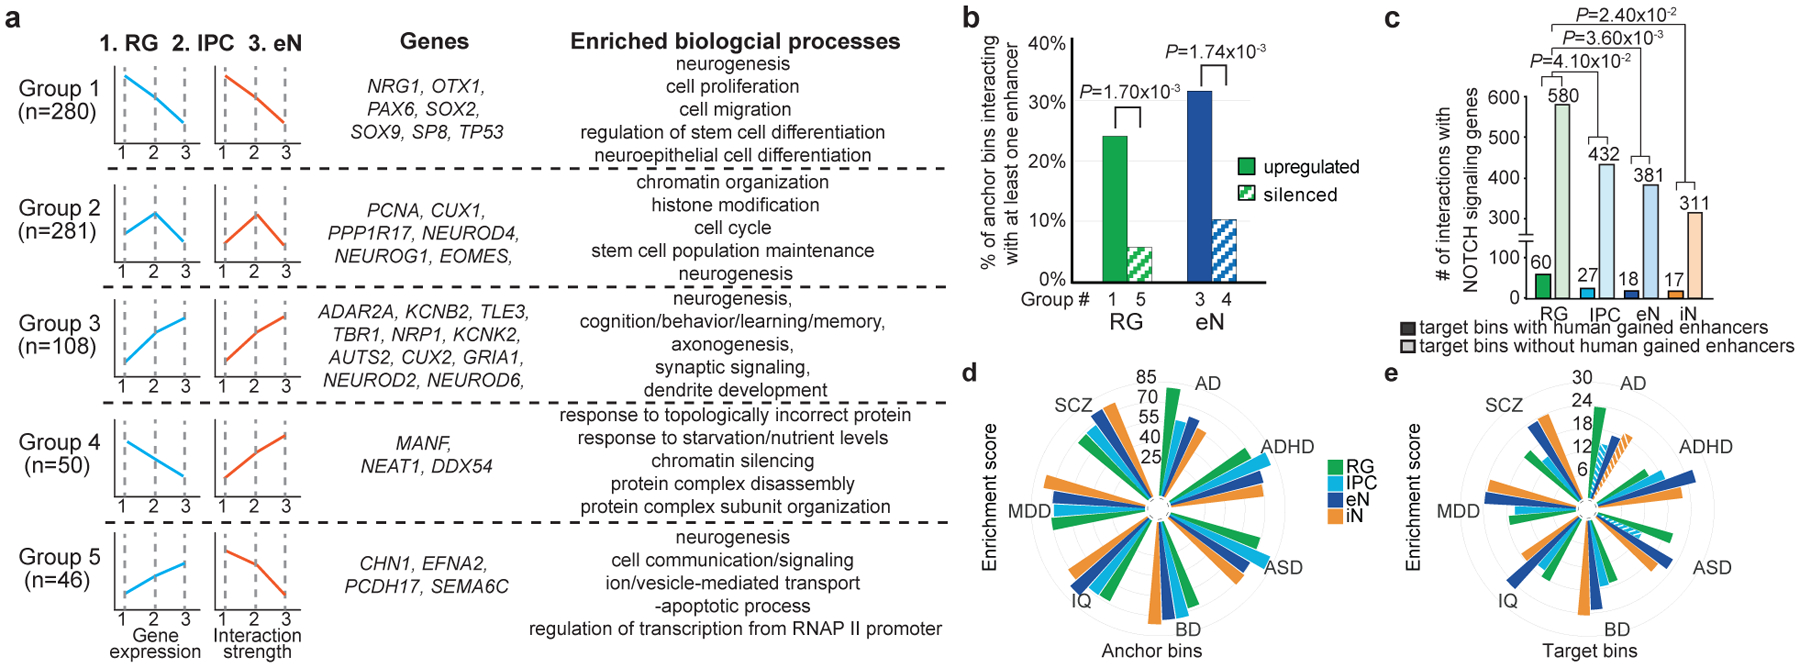
Figure 4. Features of cortical development and partitioning SNP heritability for complex disorders and traits.

(a) Genes categorized based on their gene expression and chromatin interactivity from RG to eNs. Groups 1–5 represent RG-upregulated, IPC-upregulated, eN-upregulated, eN-silenced, and RG-silenced genes, respectively. Representative genes and biological processes are shown for each group. (b) Groups 1 (75 of 312 bins) and 3 (40 of 127 bins) are enriched for interactions with enhancers relative to groups 4 (6 of 58 bins) and 5 (3 of 52 bins) (chi-squared test, two-tailed). Only bins with at least one interaction were considered. (c) Bar graph of interaction counts from Notch signaling genes to regions with and without HGEs in each cell type (chi-squared test, two-tailed). We observed 2,541, 1,854, 1,869, and 1,610 interactions with HGEs in RG, IPCs, eNs, and iNs, respectively. (d–e) LDSC enrichment scores for each disease and cell type, stratified by PLAC-seq anchor and target bins. Non-significant enrichment scores are shown as striped bars.
