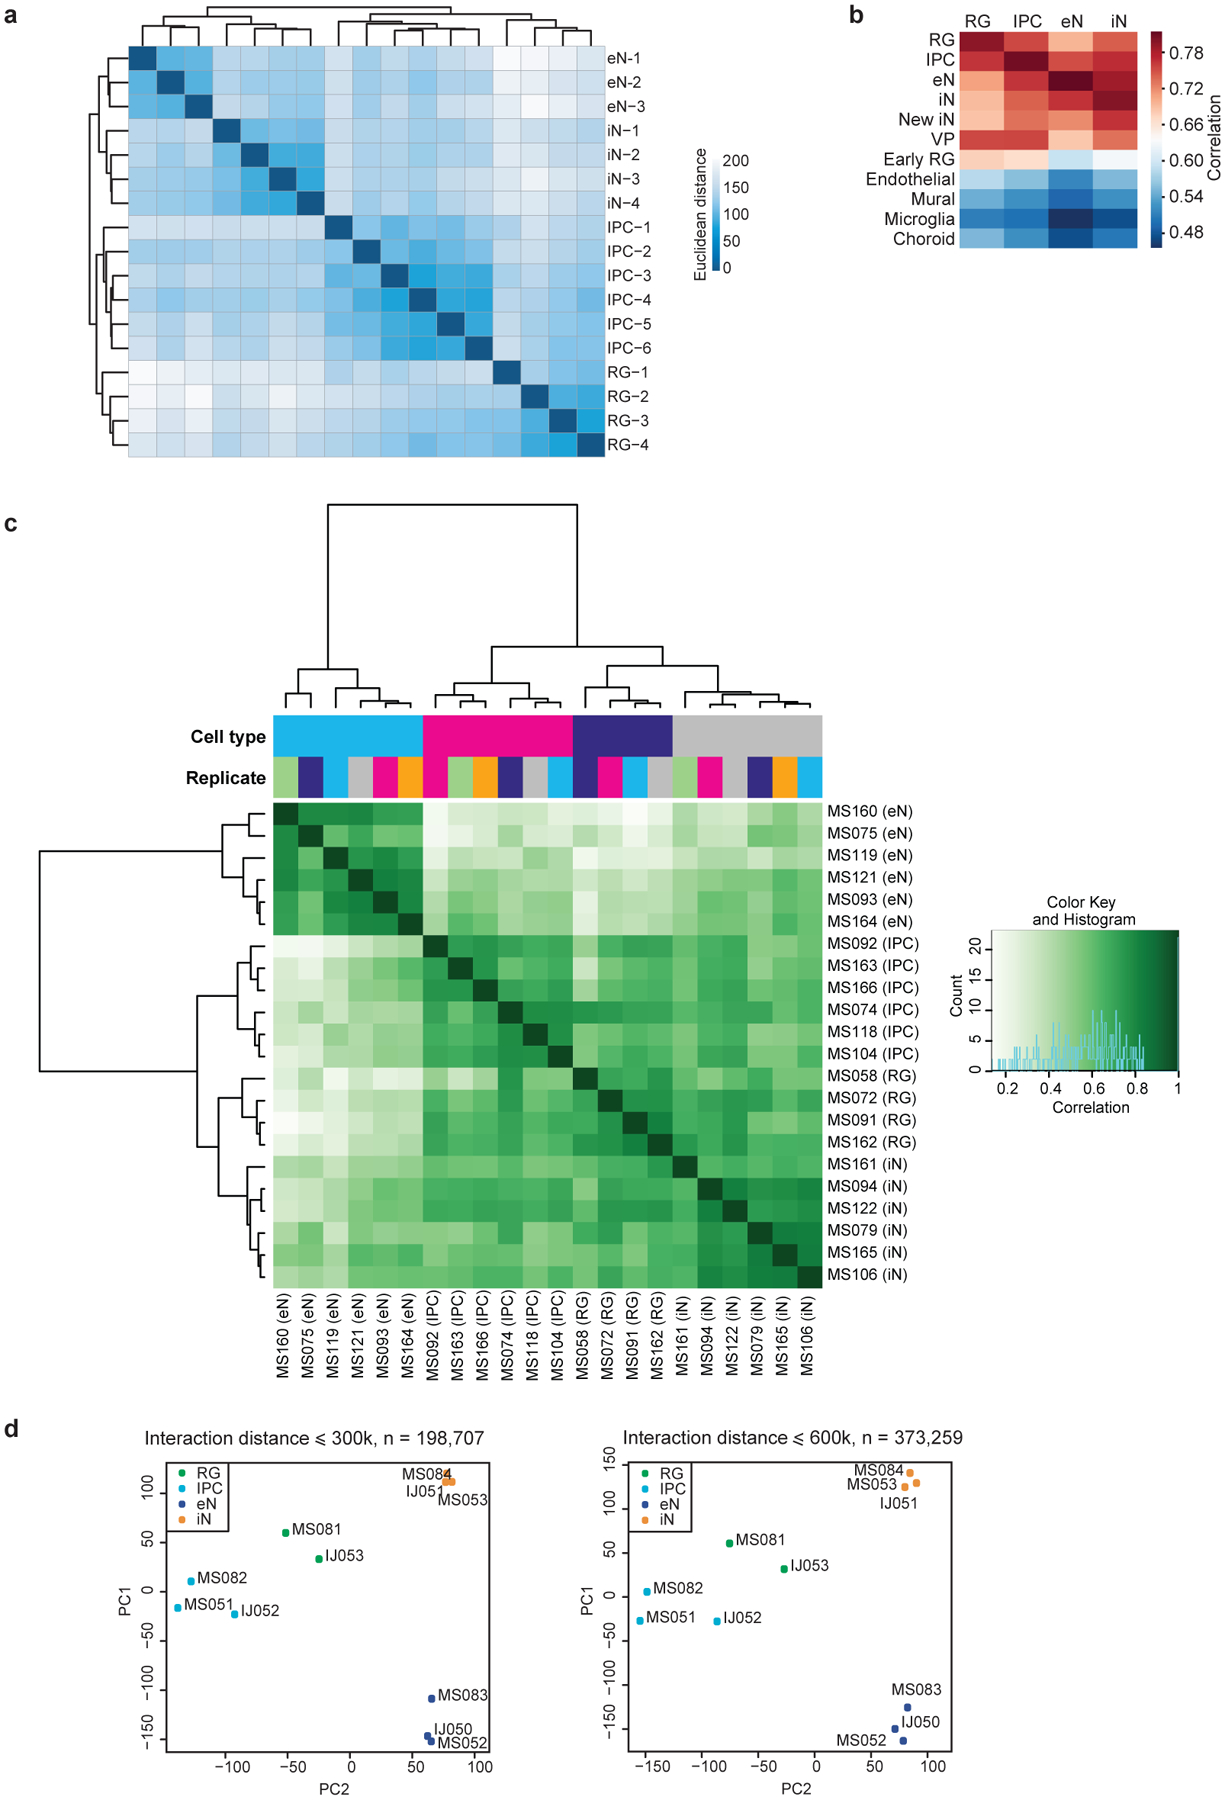
Extended Data Figure 2. Reproducibility between RNA-seq, ATAC-seq, and PLAC-seq replicates.

(a) RNA-seq replicates were hierarchically clustered according to gene expression sample distances using DESeq2. (b) Heatmap showing correlations between gene expression profiles for the sorted cell populations and single-cell RNA sequencing (scRNA-seq) data in the developing human cortex. The sorted cell populations exhibited the highest correlation with their corresponding subtypes while exhibiting reduced correlation with the endothelial, mural, microglial, and choroid plexus lineages. (c) Heatmap showing correlations and hierarchical clustering for read densities at open chromatin peaks across all ATAC-seq replicates. (d) Principle component analysis (PCA) was performed based on normalized contact frequencies across all PLAC-seq replicates (see methods). PCA was performed using interacting 5 kb bins in both 300 and 600 kb windows.
