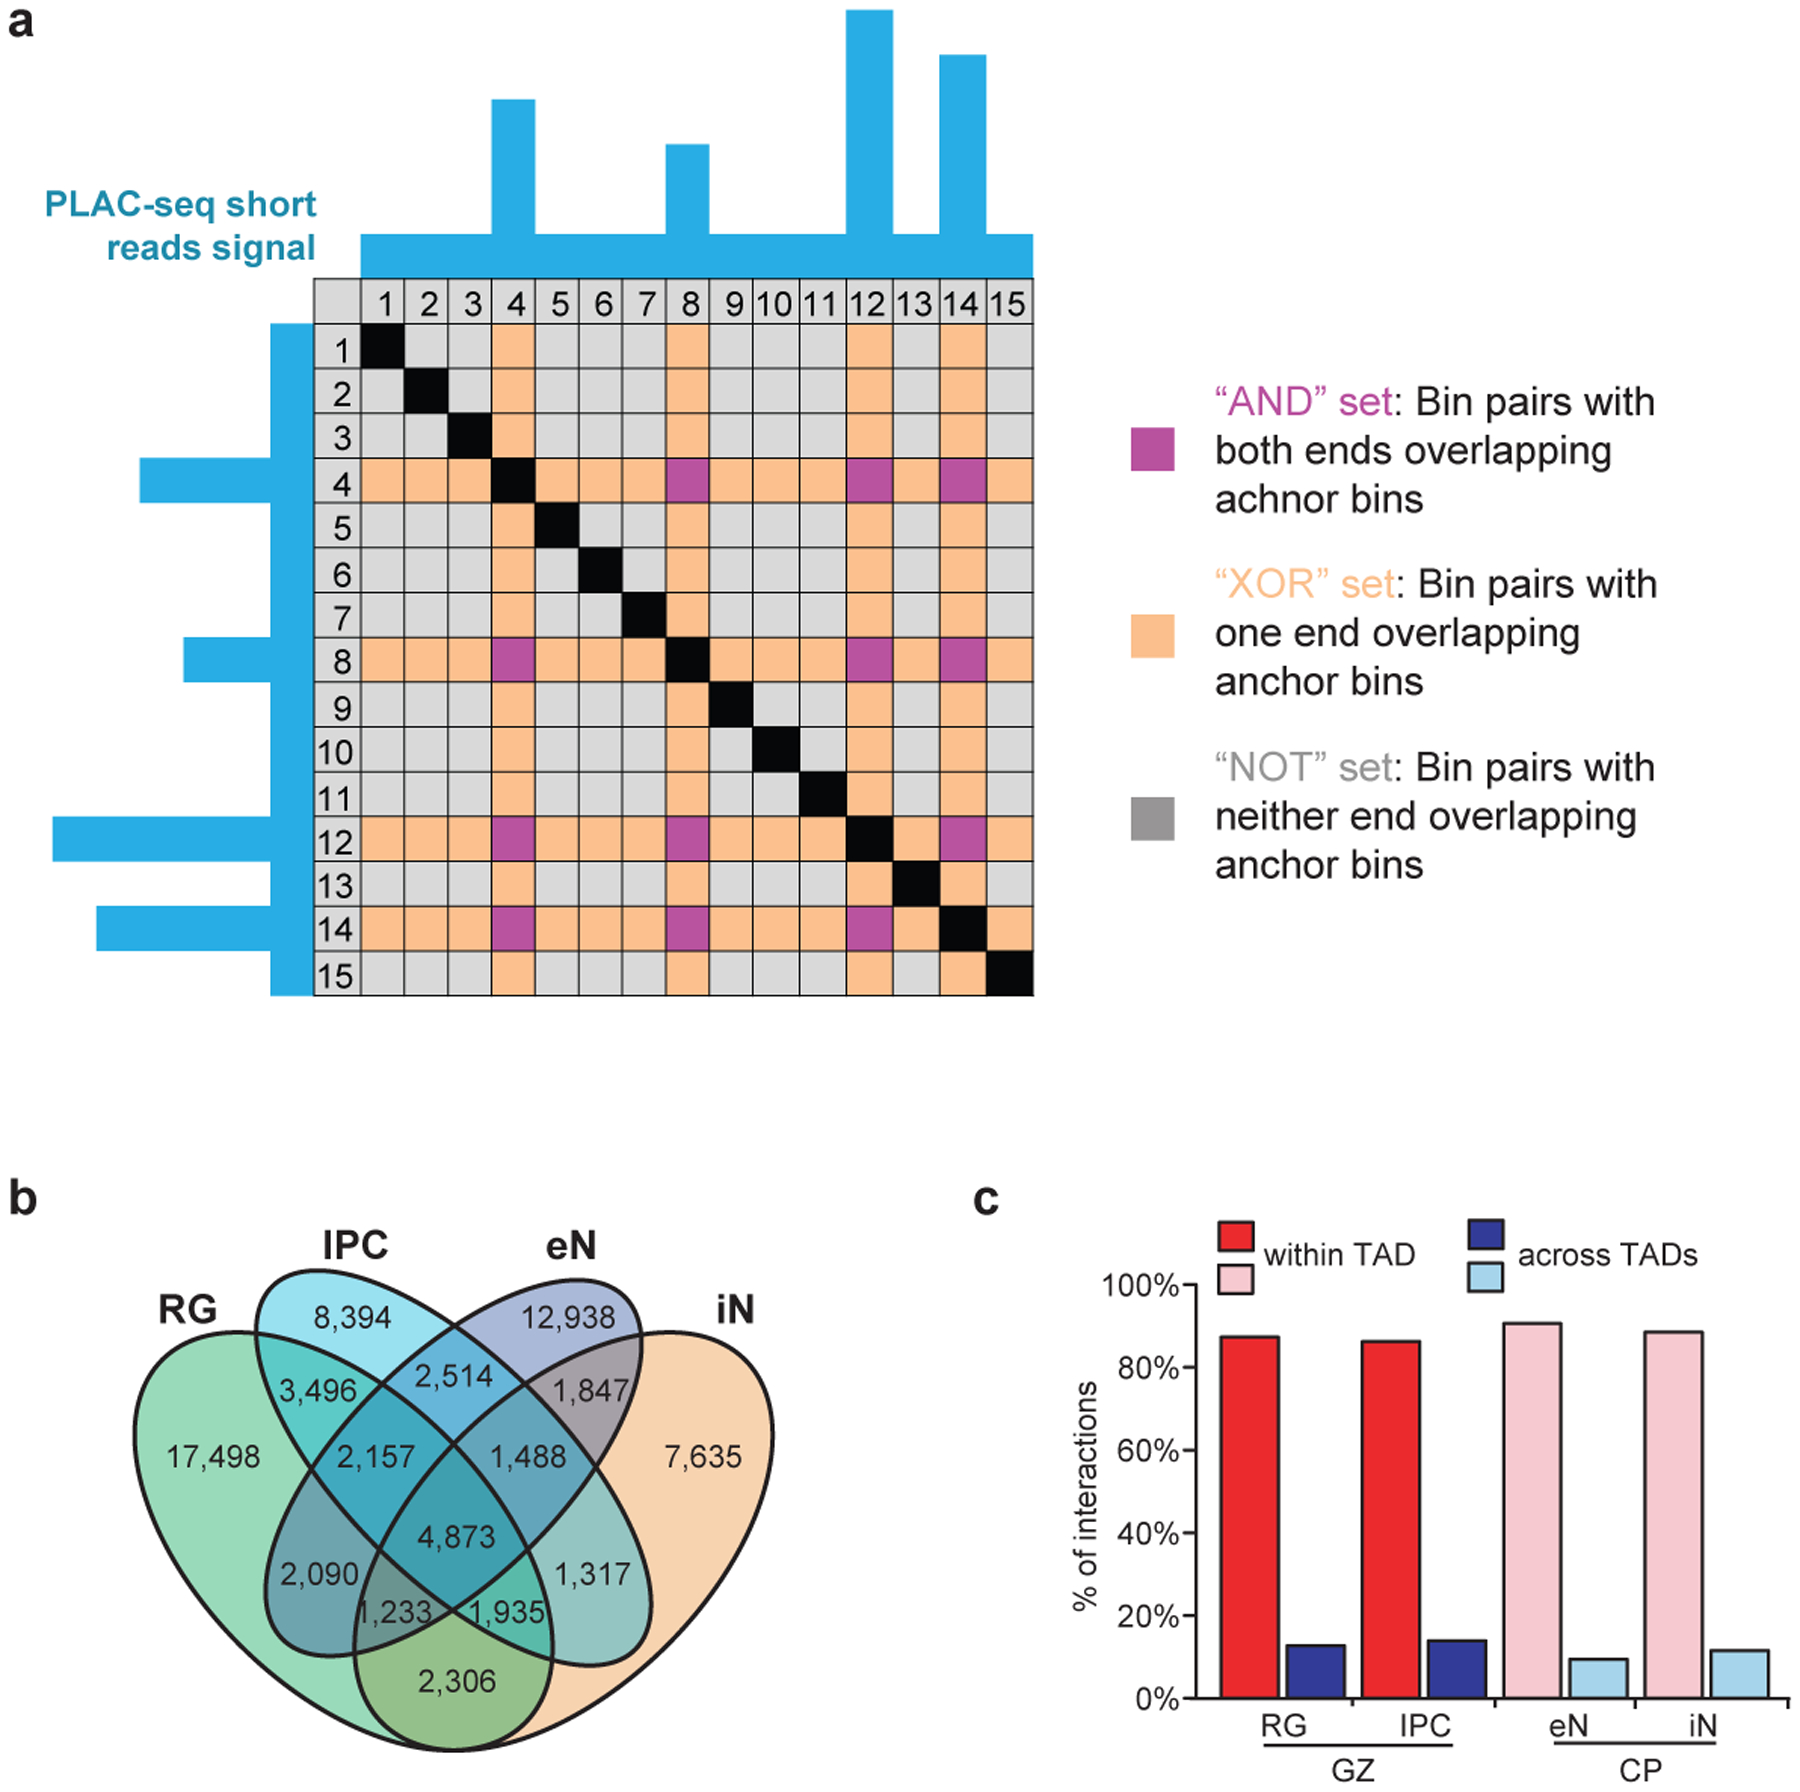
Extended Data Figure 3. Identification of significant H3K4me3-mediated chromatin interactions.

(a) Illustration of XOR and AND interactions in a representative PLAC-seq contact matrix. The blue tracks represent H3K4me3 peaks at anchor bins. Purple cells represent AND interactions where both of the interacting bins are anchor bins. Orange cells represent XOR interactions where only one of the interacting bins is an anchor bin. Grey cells represent NOT interactions where neither of the interacting bins are anchor bins. (b) Venn diagram displaying cell type-specificity for interactions in each cell type. (c) Proportions of interactions occurring within and across TADs in the GZ and CP for matching cell types.
