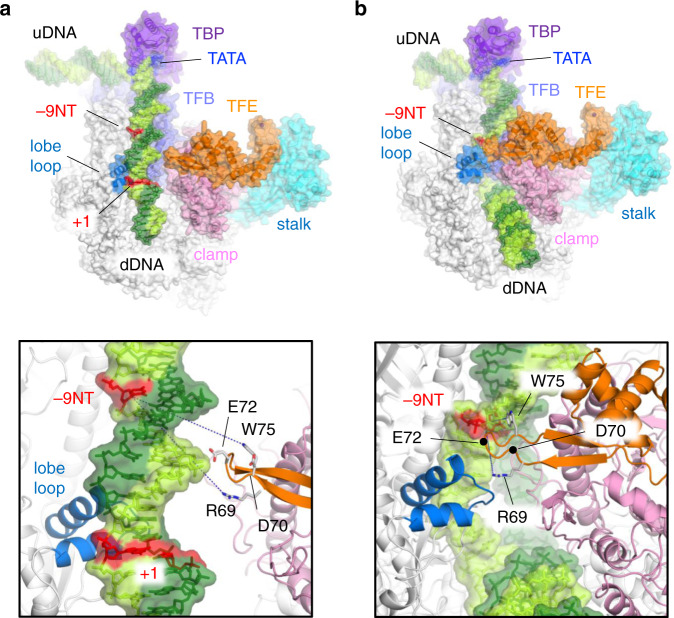
Fig. 5. Structural models of archaeal PIC and OC models.
Overall views of the PIC (a) and the OC (b). RNAP (white with pink, cyan, and light blue), TBP (purple), TFB (light purple) and TFEα (orange) are depicted as ribbon models with transparent surface. DNA is depicted as stick model with transparent surface (template DNA, dark green; non-template DNA, light green; TATA box, blue). Positions of −9 base of non-template DNA (−9NT) and transcription start site (+1) are indicated. Close-up views of DNA from −9 to +1 positions in the PIC and RPo are shown in boxes. Amino acid residues involved in the DNA interaction are depicted as stick models and labeled. TFB is removed to clarify the view.

