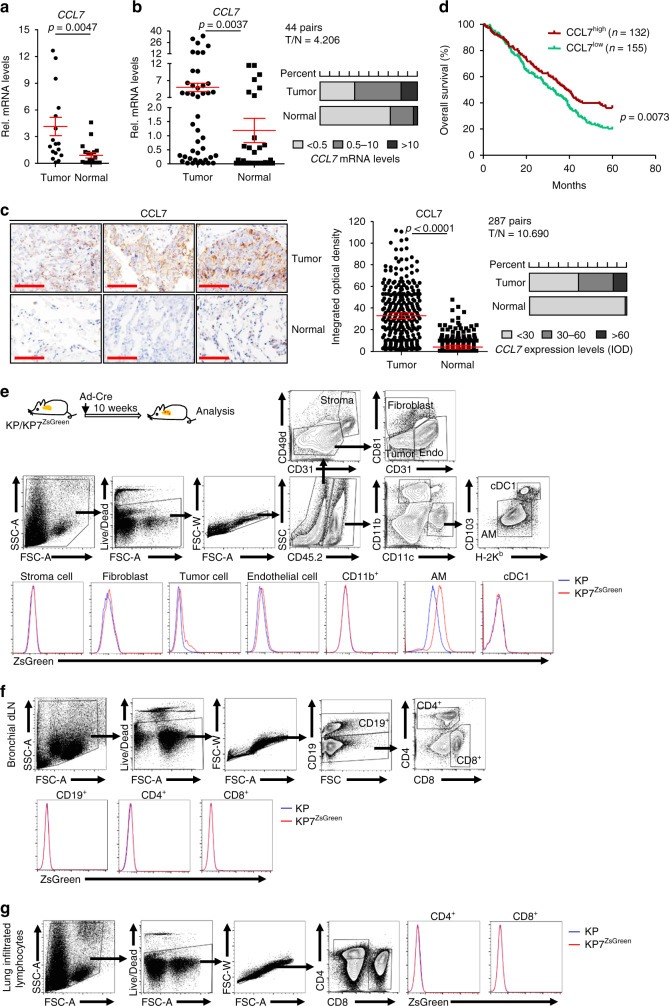
Fig. 1. CCL7 is upregulated in NSCLC tumor tissues.
a Quantitative real-time PCR (qRT-PCR) analysis of CCL7 mRNA in primary tumor and adjacent normal tissues of NSCLC patients (n = 18). b qRT-PCR analysis of CCL7 mRNA in primary tumor and adjacent normal tissues of NSCLC patients (n = 44). c Immunohistochemistry (IHC) staining (left images) and integrated optical density (IOD) analysis (right graphs) of CCL7 in tissue array of tumor and adjacent normal tissues from NSCLC patients (n = 287). d Overall survival (OS) of NSCLC patients (n = 287) based on the CCL7 protein levels. e A scheme of KP and KP7ZsGreen mice intranasally injected with Ad-Cre for 10 weeks followed by flow cytometry analysis (upper scheme). Flow cytometry analysis of single-cell suspensions of lungs from KP and KP7ZsGreen mice as treated in the above scheme (lower flow charts). f Flow cytometry analysis of immune cells in the bronchial draining lymph nodes from KP and KP7ZsGreen mice treated as in e. g Flow cytometry analysis of immune cells in the lung infiltrated lymphocytes from KP and KP7ZsGreen mice treated as in e. Two-tailed student’s t-test (a–c) and Log-rank analysis (d). T, tumor tissue; N, normal tissue; Stroma, stromal cell; Endo, endothelial cell; Tumor, tumor cell; cDC1, conventional dendritic cell 1; AM, alveolar macrophage. Graphs show mean ± SEM (a–c). Scale bars, 100 μm (c). Data are representative of two independent experiments (e–g). Source data are provided as a source data file.

