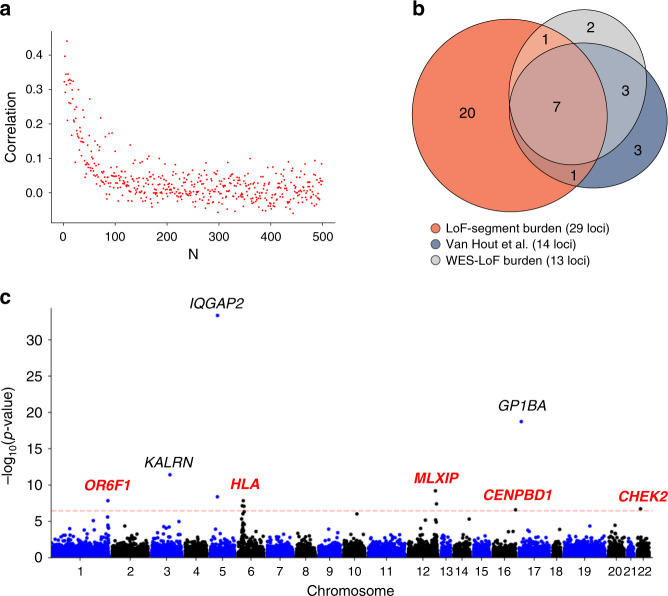
Fig. 5. IBD sharing and rare variant associations.
a Correlation between IBD sharing (average number of IBD segments per pair across UK postcodes in the past 10 generations in the UK Biobank’s 487,409 samples) and ultra-rare variants sharing (average number of FN mutations per pair across UK postcodes in the UK Biobank 50k Exome Sequencing Data Release for increasing values of N). b Venn diagram representing the sets of exome-wide significant associated loci for 7 blood-related traits using three methods: the WES-based LoF burden test reported by Van Hout et al.49, a WES-based LoF burden test we performed (WES-LoF burden), and the IBD-based LoF burden test we performed (LoF-segment burden). The corresponding p-values were computed using two-sided t-tests and are reported in Tables 1, 2 and Supplementary Table 8. c Exome-wide Manhattan plot for mean platelet (thrombocyte) volume, after SNP-correction, using 303, 125 unrelated UK Biobank samples not included in the exome sequencing cohort. Labeled genes are exome-wide significant after adjusting for multiple testing: p < 0.05/(14,249 × 10) = 3.51 × 10⁻⁷; dashed red line. Black labels indicate genes that were previously reported by Van Hout et al.49 (KALRN, GP1BA, and IQGAP2), while red labels indicate novel associations detected by our LoF-segment burden analysis. The corresponding p-values were computed using two-sided t-tests and are reported in Table 2.

