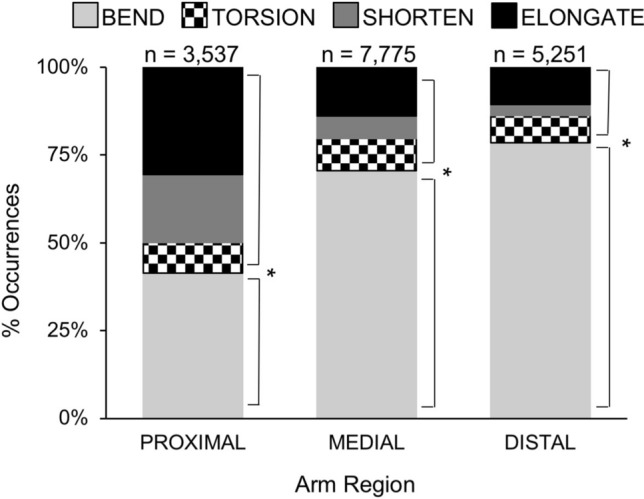
Figure 5.

Percent distribution of deformation types among arm regions in O. bimaculoides. Bar graph showing the distributions of bending, torsion, shortening, and elongation within each arm region. Bending deformations made up the greatest proportion of the deformations recorded from the medial and distal arm regions (X2 = 4680.06, p = 0.001), while bending occurred less frequently in the proximal region as compared with other deformation types. Asterisks indicate significant differences in deformation type at p < 0.01.
