

Abstract
Background:
Consumers’ access to cannabis has been considerably expanded in US states where recreational cannabis was legalized and commercialized. However, little is known about the important factors influencing consumers’ purchase decisions in cannabis retail dispensaries. This study examined cannabis users’ perceptions of the relative importance of policy-relevant factors when they made cannabis purchase decisions.
Methods:
An online survey was administered to 817 adult cannabis users in seven states in the US (California, Colorado, Maine, Massachusetts, Nevada, Oregon, and Washington) that had approved cannabis commercialization by the time of interview in January 2018. Twenty policy-relevant cannabis attributes were evaluated, including those pertaining to product characteristics, quality, package characteristics, price and free sample, store characteristics, and restrictions on use. A best-worst scaling experiment was employed, which asked respondents to select the most and the least important attributes in a choice scenario. Each respondent answered 10 choice scenarios, each including a random combination of four attributes out of the 20. The relative importance of each attribute was evaluated using hierarchical Bayesian estimation of mixed logit models.
Results:
Overall, ‘quality’, ‘strain type’, ‘price’, ‘THC’ (tetrahydrocannabinol) and ‘pesticide’ were the top five important attributes affecting cannabis users’ willingness to buy cannabis in a dispensary. These five attributes jointly accounted for approximately half of the total importance. In subsample analysis, both recreational and dual-purpose users attached higher importance to ‘quality’, ‘THC’, and ‘price’, whereas medical users tended to think ‘CBD’ (cannabidiol) and ‘pesticide’ were more important. All cannabis users perceived ‘package’ to be the least important attribute. Gender had no major differences in perceptions.
Conclusions:
Cannabis users in general perceived product characteristics, quality, and price to be important factors in their willingness to buy cannabis in dispensaries. There were heterogeneities in the perceptions by cannabis use purposes. The findings might deserve consideration in cannabis policy design.
Keywords: Best-worst scaling, Recreational Cannabis, Behavioral Economics, Consumer Preferences, Cannabis Legalization
1. Introduction
Cannabis legalization has been gaining momentum in the world in the past decade. Uruguay and Canada have approved country-wide recreational cannabis use and commercialization. In the US, since 2012, 11 states and Washington DC have legalized recreational use of cannabis. Among these jurisdictions, nine further approved retail sales. (NCSL, 2018) By February 2020, Alaska, California, Colorado, Illinois, Massachusetts, Michigan, Nevada, Oregon, and Washington had licensed dispensaries to provide legal supply of cannabis to adults aged 21 years or older.
Legal retail markets of cannabis in the US have expanded rapidly. In Colorado, annual sales of cannabis increased from $683 million in 2014 to $1,545 million in 2018 (CDOR, 2019), and the number of licensed dispensaries grew by nearly 400% during 2014–2017 (Orens, Light, Lewandowski, Rowberry, & Saloga, 2018). In Washington, annual retail sales increased from $259 million in 2015 to $1,371 million in 2017. (WSLCB, 2019) In California, over 600 dispensaries were licensed and in operation in 2019 (BCC, 2019); the annual sales were $2.5 billion in 2018 and anticipated to be $3.1 billion in 2019 (Mcgreevy, 2019). Cannabis flowers are dominating the retail sales, accounting for two-thirds of the legal market share. (Orens, et al., 2018; Smart, Caulkins, Kilmer, Davenport, & Midgette, 2017)
The existing regulatory frameworks for cannabis retail sales in the US were largely relied upon lessons learned from tobacco and alcohol control (Pacula, Kilmer, Wagenaar, Chaloupka, & Caulkins, 2014), including policies limiting potency, ensuring product safety and quality, regulating packaging and labeling, collecting tax, restricting access and availability, and banning public use. Nonetheless, existing research on the impacts of recreational cannabis legalization is just emerging and almost all focused on binary indicators of passing or implementing the laws. (Aydelotte, et al., 2017; Cerda, et al., 2017; Hansen, Miller, & Weber, 2018; Kerr, Bae, Phibbs, & Kern, 2017; Shi & Liang, 2020; Shi, Liang, et al., 2019) The empirical evidence using observational data to evaluate the impacts of specific strategies regulating retail sales is scanty. Only one study in Denver, Colorado examined density of cannabis dispensaries and cannabis-related crime rates and found a positive association. (Freisthler, Gaidus, Tam, Ponicki, & Gruenewald, 2017)
The lack of knowledge on how responsive consumers might be to specific cannabis policies significantly hinders evidence-based policy design. While more empirical research is warranted, data unavailability remains a major challenge. Repeated cross-sectional or longitudinal observational data that are often used for cannabis policy impact evaluation, such as large-scale population surveys and healthcare utilization records, are mostly unavailable at this moment because commercialization was initiated just recently, and data release often has delays. Another challenge is the multicollinearity of multiple cannabis policy strategies, which were usually implemented simultaneously in a state. Further, ecological studies with population data cannot infer causality at individual level. (Caputi & Sabet, 2018; Harris, Humphreys, & Finney, 2015)
To address these limitations, in this study we collected primary survey data using Best-Worst Scaling (BWS, also referred as maximum difference scaling) experiment, a stated preferences technique for choice modeling. (Flynn, Louviere, Peters, & Coast, 2007; Louviere, Lings, Islam, Gudergan, & Flynn, 2013). The core concept of BWS is to elicit respondents’ tradeoffs between paired attributes. In a BWS task, respondents are shown a random subset of attributes from a master list and asked to indicate the most important and the least important attributes out of the subset. By systematically repeating BWS tasks multiple times, we will be able to estimate the relative importance of each attribute perceived by individuals.
BWS has several advantages over observational data or revealed preferences data. Because the choice scenarios are hypothetical, it can incorporate hypothetical attributes or attributes lacking observational data. It can overcome multicollinearity by showing a limited subset of attributes to respondents each time and repeating this practice multiple times. It can derive strong causal inferences at individual level by exploiting variations in choices made by the same individual in a controlled setting. Compared to traditional ranking methods that ask respondents to rank order the full set of attributes at once or rate the attributes with rating scales (e.g., Likert scales), BWS also considerably reduces cognitive burden, forces a discriminating choice, and addresses scaler inequivalence caused by differences in response styles. (Erdem, Rigby, & Wossink, 2012; Flynn, et al., 2007) BWS further has advantages over other stated preferences techniques that have been used in cannabis research. For example, some studies randomly presented products with varying levels of a single attribute (Leos-Toro, Fong, Meyer, & Hammond, 2019, 2020) or a limited number of attributes (Goodman, Leos-Toro, & Hammond, 2019; Mutti-Packer, Collyer, & Hodgins, 2018; Shi, Cao, Shang, & Pacula, 2019) such as packages, warning messages, labeling, and asked respondents’ perceptions and intention to use on each type of cannabis product. Other studies used simulated purchase tasks to elicit respondents’ hypothetical demand for a cannabis product with escalated price levels. (Aston & Meshesha, 2020) Although these studies shared the strengths of hypothetical attributes and settings and individual-level causality, they were limited by the number of attributes that can be simultaneously estimated. BWS allows us to estimate the relative importance of a long list of attributes. It is especially suitable when decisionmakers consider prioritizing only a few attributes out of a large number of candidates. Despite its wide adoption in healthcare research, (Flynn, et al., 2007) however, BWS’s application to drug use research is almost nonexistent.
This study is the first implementation of BWS experiment to elicit cannabis users’ perceived importance of a wide range of cannabis attributes in consumers’ purchase decisions. We examined as many as 20 key attributes that are relevant and critical to cannabis retail sale regulation, including those pertaining to product characteristics, quality, package characteristics, price and free sample, store characteristics, and restrictions on use. Most of these attributes were examined for the first time in this study. Because medical and recreational use of cannabis have different implications to policymaking, the evaluations were also conducted in subsamples categorized by cannabis use purposes. We also conducted evaluations by gender, whose purchase preferences may have heterogeneities as we commonly see on other products. (Croson & Gneezy, 2009; Meyers-Levy & Loken, 2015) The findings are expected to inform policy design regarding consumers’ potential responsiveness to various cannabis regulatory strategies that aim to control or modify these attributes. The estimation on the relative importance of each attribute will facilitate policymaking in terms of prioritizing policy measures when resources are limited. The subsample analysis by cannabis use purposes will also provide options for heterogeneous policy design if policymakers intend to impact recreational and medical users differentially.
2. Methods
2.1. Data source and study sample
An online survey with BWS experiment was conducted in January 2018. We recruited a convenience sample of cannabis users through Qualtrics, a marketing company partnering with online panel providers to provide access to millions of US adult panelists. To be eligible to participate in the survey, respondents must 1) be residing in one of the seven states (California, Colorado, Maine, Massachusetts, Nevada, Oregon, and Washington) that had legalized recreational cannabis and approved retail sales before the survey was conducted; 2) be 21 years or older, passing the age limit for legal purchase of recreational cannabis;3) have used cannabis at least once in the past 12 months. The survey was implemented with Qualtrics online survey software, lasting 15 minutes on average. A series of measures were adopted to improve data quality, including 1) digital identification technology to avoid repeated participation, 2) removal of respondents who completed the survey within a minimum duration threshold, 3) removal of respondents who failed attention check questions. A total of 817 cannabis users entered the final analysis. The University of California San Diego Human Research Protections Program approved this study (IRB # 161479).
2.2. Best-Worst Scaling experiment design
The core component of the survey was BWS tasks on cannabis attributes. To develop BWS tasks, we first developed a long master list of cannabis attributes (Table 1). As shown in Figure S1, we selected not only intrinsic attributes (product characteristics, quality, and package characteristics) but also extrinsic attributes (price and free sample, store characteristics, and restrictions on use). Intrinsic attributes relate to the function of a product, thus the changes of intrinsic attributes directly alter the product. Extrinsic attributes are not directly related to the product but are relevant to the contextual environment of purchase or use. (Enneking, Neumann, & Henneberg, 2007) The final master list contained 20 attributes (12 intrinsic attributes and 8 extrinsic attributes) with detailed descriptions in Table 1. It covered a wide range of factors that may influence consumers’ cannabis purchase decisions. Most of the factors are modifiable by existing or potential cannabis policies.
Table 1.
20 Attributes Examined in the Best-Worst Scaling Experiment.
| Attributes Product Characteristics | Question Texts | |
|---|---|---|
| 1 | THC | Delta-9-Tetrahydrocannabinol level. |
| 2 | CBD | Cannabidiol level. |
| 3 | Strain type | What is the type of the flower strain (Sativa, Indica, or Hybrid). |
| 4 | Flavor | Whether the marijuana flower comes in flavors like fruit and sweets. |
| Product Quality | ||
| 5 | Quality | Whether you can observe seeds, stems, and shake as well as dry, compacted nugs in the product. |
| 6 | Origin | Where the marijuana plant grew and whether it was planted by a licensed, professional grower. |
| 7 | Pesticide | Whether the marijuana flower is pesticide-free. |
| 8 | Lab-test | Whether the marijuana flower has been lab-tested. |
| Package Characteristics | ||
| 9 | Label instruction | Whether detailed instructions of using the product are offered on the package. |
| 10 | Label warning | Whether warnings about negative health effects is offered on the package. |
| 11 | Date of harvest | Whether the expiration date is offered on the package. |
| 12 | Package | Whether the product packaging is appealing to you. |
| Price and Free Sample | ||
| 13 | Price | How much it costs after tax. |
| 14 | Free sample | Whether the store offers free marijuana samples to customers. |
| Store Characteristics | ||
| 15 | Compliance to law | Whether the retail store has a strict ID verification policy and whether the store strictly follows the legal limit of how much a customer can buy each time. |
| 16 | Staff | Whether the marijuana retail store staff are knowledgeable and friendly. |
| 17 | Distance | How far the retail store is from your home or work. |
| 18 | Store hours | Whether the retail store opens in late hours, such as midnight. |
| Restrictions on Use | ||
| 19 | Public use | Whether marijuana can be used in public places (e.g., workplace, restaurants, bars, nightclubs, airports, college campuses) in your city. |
| 20 | Employer | Whether employers can fire an employee for failing a company drug test in your city. |
Notes. “Marijuana” instead of “cannabis” was used in the survey because it is more commonly used in the US.
We then randomly drew four attributes out of the master list of 20 attributes to compose a BWS task. Because the total number of possible BWS tasks with four attributes in each is enormous , it is unlikely for a respondent to complete all the possible tasks in a single survey. We thus used the balanced block design to reduce cognitive burden. (Reed Johnson, et al., 2013) Using SAS JMP software for conjoint analysis (Version 13), we randomly selected 40 BWS tasks and divided them into four blocks (blocking), with each attribute appearing equally often in a block (balanced). A respondent was randomly assigned to one block of 10 BWS tasks, each of which asked the respondent to select the most important and the least important attributes when making a purchase decision on cannabis flowers in a legal cannabis retail dispensary. Cannabis flowers accounted for two thirds of the sales in legal market in the US. (Orens, et al., 2018; Smart, et al., 2017) Although concentrates and edibles were increasingly popular in recent years, (Smart, et al., 2017) they were not considered in this study because attributes associated with flowers may be inapplicable to concentrates or edibles and vice versa. We instructed the respondents to imagine the purchase of standard 1/8th ounce flowers (approximately 3.5 grams), the most popular sale unit in legal market, (Smart, et al., 2017) in a legal retail dispensary. An example of BWS task is illustrated in Figure S2.
2.3. Individual characteristics
In addition to the BWS experiment, the online survey also asked questions about cannabis use behaviors and sociodemographic characteristics. Cannabis use behaviors included age of cannabis initiation, current use status (whether using cannabis in the past 30 days), frequent use status (whether using cannabis at least 20 days in the past 30 days), and ever obtaining cannabis in a legal dispensary. Sociodemographic characteristics included gender, age, race/ethnicity, education, household income, employment status, past-month cigarette smoking status, past-month binge drinking status (5 drinks or more in a single occasion), and state of residence.
We also asked about purposes of cannabis use. Specifically, based on responses to the question “was it primarily for medical reasons to treat or decrease symptoms of a health condition, or was it primarily for recreational reasons to get pleasure or satisfaction” when using cannabis, the respondents were classified as recreational users if the response was “primarily for recreational reasons”, as medical users if the response was “primarily for medical reasons”, and as dual-purpose users if the response was “for both medical and recreational reasons”.
2.4. Statistical analyses
The sample characteristics were provided for the full sample as well as subsamples by cannabis use purposes and gender.
To describe the importance of the 20 attributes, following previous research, (Auger, Devinney, & Louviere, 2007; Lagerkvist, 2013) we started with computing the simple difference in BWS scores, which was done by counting the times each attribute was selected as the most important attribute and the times it was selected as the least important attribute without any statistical adjustment. Specifically, in each BWS task, we assigned +1 score to the attribute that was chosen as the most important, −1 score to the attribute that was chosen as the least important, and 0 score to the remaining two attributes. For each attribute, we aggregated the assigned scores across all the tasks and all the respondents, with a greater positive sum score indicating a higher importance attached to the attribute. We then rank ordered the 20 attributes by their sum scores to determine the order of the perceived importance of each attribute. This approach was suggested to be a close approximation of the estimations from regression analysis. (Marley & Louviere, 2005) The analysis was conducted in the full sample as well as subsamples by cannabis use purposes and gender.
We then conducted hierarchical Bayesian mixed logit models to statistically estimate the relative importance of the 20 attributes. The models were based on Random Utility theory of decision making that was developed by Thurstone (Thurstone, 1927), generalized by McFadden (Daniel McFadden, 1973), and widely used in healthcare research (Flynn, et al., 2007). The theory assumes that each attribute has a value on the latent utility scale, thus the choice of a given pair (the most important and the least important attributes) maximizes the utility difference in a BWS task. (Erdem, et al., 2012)
As cannabis users may differ in characteristics and preferences, we used mixed logit models (also called random parameter logit models) to allow the heterogeneity of the allocated importance across individuals. (D. McFadden & Train, 2000) Hierarchical Bayesian simulation method was used to estimate the probability distribution of the parameters. Because a reference location must be defined in logit models, we set the mean of the parameter of ‘THC’ (Tetrahydrocannabinol) to be 0 with a 0 variance. The estimations for the remaining parameters were then relative to ‘THC’. A positive estimated parameter of an attribute suggested that this attribute was more important than ‘THC’ and a negative estimated parameter suggested that the associated attribute was less important than ‘THC’. To ease interpretation, we also rescaled the estimated parameter mean to 0–100, such that the sum of the rescaled scores was 100. (Hendriks, et al., 2018) A rescaled score of 10 would indicate twice the importance of a score of 5. The rescaled score can be interpreted as share of relative importance; a score of 10 would indicate that the associated attribute accounted for 10% of the total importance of all the attributes. The analysis was conducted in the full sample as well as in subsamples by cannabis use purposes and gender.
Package “flipMaxDiff” in statistical software R (Version 3.6.1) was used for mixed logit regressions and statistical software Stata (Version 15.1) was used for all the remaining statistical analyses.
3. Results
3.1. Sample characteristics
The overall sample characteristics are reported in Table 2. Of the 817 respondents, 266 (32.55%) were recreational users, 211 (25.83%) were medical users, and the remaining 340 respondents (41.62%) were dual-purpose users. Female respondents accounted for roughly three quarters of the sample, much higher than the proportion of female cannabis users in the 2018 US nationally representative National Survey on Drug Use and Health (Table S1). Most of the respondents had experience purchasing cannabis in legal dispensaries. The subsamples by cannabis use purposes (Table 2) differed in most characteristics whereas the subsamples by gender had little differences (Table S2).
Table 2.
Characteristics of Study Sample (Full Sample and Subsamples by Cannabis Use Purposes)
| Characteristics | Full Study Sample (N = 817) | By Purpose of Cannabis Recreational Users (N = 266) | Use Medical Users (N=211) | Dual-purpose Users (N = 340) | Between Group Difference Test P-value |
|---|---|---|---|---|---|
| % | % | ||||
| Age starting cannabis use | |||||
| <=17 | 59.49% | 56.39% | 53.55% | 65.59% | 0.009 |
| >17 | 40.51% | 43.61% | 46.45% | 34.41% | |
| Current use (in past 30 days) | |||||
| Yes | 70.62% | 65.53% | 61.14% | 82.06% | 0.000 |
| No | 29.38% | 34.47% | 38.86% | 17.94% | |
| Frequent use (days of cannabis use in past 30 days >=20) | |||||
| Yes | 37.70% | 22.18% | 32.70% | 52.94% | 0.000 |
| No | 62.30% | 77.82% | 67.30% | 47.06% | |
| Ever obtained cannabis from cannabis retail stores or medical cannabis dispensaries | |||||
| Yes | 71.36% | 54.51% | 76.78% | 81.18% | 0.000 |
| No | 28.64% | 45.49% | 23.22% | 18.82% | |
| Gender | |||||
| Male | 24.85% | 31.95% | 20.85% | 21.76% | 0.005 |
| Female | 75.15% | 68.05% | 79.15% | 78.24% | |
| Age | |||||
| 21–29 | 41.37% | 45.86% | 32.23% | 43.53% | 0.009 |
| 30–44 | 36.11% | 31.58% | 39.34% | 37.65% | |
| 45+ | 22.52% | 22.56% | 28.44% | 18.82% | |
| Race/ethnicity | |||||
| Non-Hispanic white | 61.57% | 59.02% | 62.56% | 62.94% | 0.364 |
| Hispanic | 23.01% | 22.93% | 25.59% | 21.47% | |
| Non-Hispanic other minority | 15.42% | 18.05% | 11.85% | 15.59% | |
| Education | |||||
| High School or less | 30.35% | 30.08% | 31.75% | 29.71% | 0.006 |
| Some college | 43.82% | 36.84% | 43.60% | 49.41% | |
| College degree or more | 25.83% | 33.08% | 24.64% | 20.88% | |
| Household income | |||||
| <$25,000 | 30.72% | 24.06% | 34.12% | 33.82% | 0.053 |
| $25,000-$50,000 | 27.54% | 27.07% | 25.59% | 29.12% | |
| $50,000-$75,000 | 17.01% | 18.42% | 16.59% | 16.18% | |
| >$75,000 | 24.72% | 30.45% | 23.70% | 20.88% | |
| Employment status | |||||
| Full-time employed | 46.88% | 58.27% | 38.86% | 42.94% | 0.000 |
| Part-time employed | 17.63% | 19.17% | 18.96% | 15.59% | |
| Not working | 35.50% | 22.56% | 42.18% | 41.47% | |
| Past-month cigarette smoking | |||||
| Yes | 39.90% | 32.71% | 36.49% | 47.65% | 0.000 |
| No | 60.10% | 67.29% | 63.51% | 52.35% | |
| Past-month binge drinking | |||||
| Yes | 79.93% | 75.94% | 80.57% | 82.65% | 0.119 |
| No | 20.07% | 24.06% | 19.43% | 17.35% | |
| State of residence | |||||
| California | 46.76% | 45.49% | 53.08% | 43.82% | 0.094 |
| Other states | 53.24% | 54.51% | 46.92% | 56.17% | |
3.2. Simple count score and ranking
Table 3 presents the counting results for each attribute in the full sample. ‘Quality’ (count score=720), ‘strain type’ (631), ‘price’ (505), ‘THC’ (467), and ‘pesticide’ (390) were the five attributes with the highest count scores, whereas ‘free sample’, ‘label warning’, ‘store hours’, ‘label instruction’, and ‘package’ were the five attributes with the lowest count scores.
Table 3.
Relative Importance of 20 Cannabis Attributes: Simple Count Score and Ranking (Full Sample and Subsamples by Cannabis Use Purposes)
| Attributes | Total (N = 817) | By Cannabis Use Purposes Recreational Users (N = 266) | Medical Users (N=211) | Dual-purpose Users (N = 340) | ||||
|---|---|---|---|---|---|---|---|---|
| Count Score | Ranking | Count Score | Ranking | Count Score | Ranking | Count Score | Ranking | |
| Product Characteristics | ||||||||
| THC | 467 | 4 | 136 | 4 | 43 | 7 | 288 | 3 |
| CBD | 291 | 6 | 20 | 7 | 123 | 3 | 148 | 5 |
| Strain type | 631 | 2 | 172 | 3 | 133 | 1* | 326 | 1* |
| Flavor | −100 | 12 | −25 | 12 | −53 | 14 | −22 | 9 |
| Product Quality | ||||||||
| Quality | 720 | 1 | 261 | 1 | 133 | 1* | 326 | 1* |
| Origin | −49 | 10 | 10 | 8 | −11 | 10 | −48 | 11 |
| Pesticide | 390 | 5 | 124 | 5 | 121 | 4 | 145 | 6 |
| Lab test | −65 | 11 | −27 | 13 | 15 | 9 | −53 | 12 |
| Package Characteristics | ||||||||
| Label instruction | −488 | 19 | −155 | 18 | −80 | 16 | −253 | 19 |
| Label warning | −362 | 17 | −139 | 17 | −40 | 12 | −183 | 18 |
| Date of harvest | −45 | 9 | −11 | 10 | −23 | 11 | −11 | 8 |
| Package | −604 | 20 | −202 | 20 | −120 | 20 | −282 | 20 |
| Price and Free Sample | ||||||||
| Price | 505 | 3 | 189 | 2 | 81 | 5 | 235 | 4 |
| Free Sample | −332 | 16 | −80 | 15 | −111 | 19 | −141 | 16 |
| Store Characteristics | ||||||||
| Compliance to law | 34 | 8 | 26 | 6 | 50 | 6 | −42 | 10 |
| Staff | 53 | 7 | 10 | 8 | 23 | 8 | 20 | 7 |
| Distance | −132 | 13 | −13 | 11 | −53 | 14 | −66 | 13 |
| Store hours | −401 | 18 | −158 | 19 | −102 | 18 | −141 | 17 |
| Restrictions on Use | ||||||||
| Public use | −299 | 15 | −95 | 16 | −83 | 17 | −121 | 14 |
| Employer | −214 | 14 | −43 | 14 | −46 | 13 | −125 | 15 |
Notes:
Count score for attribute i= (the number of total times the attribute i was chosen as the most important) - (the number of total times the attribute i was chosen as the least important).
indicates that the two attributes were tied with identical ranking in the same column.
By cannabis use purposes (Table 3), recreational users perceived ‘quality’, ‘price’ and ‘strain type’ to be the most important (count score=261, 189, and 172, respectively), medical users perceived ‘quality’, ‘strain type’ and ‘CBD’ to be the most important (count score=133, 133, and 123, respectively), and dual-purpose users perceived ‘quality’, ‘strain type’, and ‘THC’ to be the most important (count score=326, 326, and 288, respectively). All the three subsamples perceived ‘package’ to be the least important attribute.
By gender (Table S3), ‘quality’, ‘strain type’, ‘price’, ‘THC’, and ‘pesticide’ were the five most important attributes in both females (count score=550, 500, 395, 350, and 328, respectively) and males (count score=170, 131, 110, 117, and 62, respectively). Both genders perceived ‘package’ to be the least important attribute.
3.3. Hierarchical Bayesian estimation of mixed logit regressions
Table 4 reports the results on parameter estimations and the rescaled share of importance from mixed logit regressions in the full sample. To facilitate understanding, we also plot the ranking of the shared importance in Figure 1. The results were overall consistent with the analysis of simple counts. ‘Quality’, `strain type’, ‘price’, ‘THC’, and ‘pesticide’ were the five most important attributes; they jointly accounted for 53.54% of the total shares of importance. ‘Public use’, ‘label warning’, ‘store hours’, ‘label instruction’, and ‘package’ were the five least important attributes; they jointly accounted for only 7.98% of the total shares of importance. In terms of attribute categories, respondents in general allocated higher importance to product characteristics, quality, and price and free sample, whereas attached lower importance to package characteristics and restrictions on use.
Table 4.
Relative Importance of 20 Cannabis Attributes: Hierarchical Bayesian Estimation of Mixed Logit Regressions (Full Sample and Subsamples by Cannabis Use Purposes)
| Attributes | All (N = 817) | By Cannabis Use Purposes Recreational Users (N = 266) | Medical Users (N = 211) | Dual-purpose Users (N = 340) | ||||||||
|---|---|---|---|---|---|---|---|---|---|---|---|---|
| Mean | Std. dev. (std. err.) | Share of importance (%) | Mean | Std. dev. (std. err.) | Share of importance (%) | Mean | Std. dev. (std. err.) | Share of importance (%) | Mean | Std. dev. (std. err.) | Share of importance (%) |
|
| Product Characteristics | ||||||||||||
| THC | 0 | 0 | 9.21 | 0 | 0 | 8.49 | 0 | 0 | 6.04 | 0 | 0 | 13.47 |
| CBD | −0.30 (0.07) | 1.28 (0.08) | 7.31 | −0.64 (0.12) | 0.85 (0.14) | 5.09 | 0.81 (0.14) | 1.65 (0.15) | 10.36 | −0.80 (0.11) | 1.13 (0.13) | 7.03 |
| Strain type | 0.29 (0.07) | 1.32 (0.09) | 11.32 | 0.22 (0.13) | 1.21 (0.13) | 9.97 | 0.54 (0.13) | 1.10 (0.15) | 8.78 | 0.04 (0.12) | 1.14 (0.14) | 13.90 |
| Flavor | −1.14 (0.07) | 1.15 (0.08) | 3.54 | −0.98 (0.12) | 1.29 (0.14) | 3.76 | −0.79 (0.13) | −1.03 (0.16) | 3.18 | −1.56 (0.12) | 1.17 (0.12) | 3.53 |
| Product Quality | ||||||||||||
| Quality | 0.57 (0.07) | 1.27 (0.08) | 13.68 | 1.09 (0.14) | 1.57 (0.15) | 16.90 | 0.67 (0.14) | 1.02 (0.18) | 9.52 | 0.22 (0.12) | 1.31 (0.13) | 15.75 |
| Origin | −0.98 (0.07) | −0.98 (0.08) | 4.10 | −0.83 (0.12) | −1.02 (0.14) | 4.32 | −0.39 (0.13) | −1.20 (0.16) | 4.46 | −1.66 (0.11) | 0.94 (0.13) | 3.21 |
| Pesticide | −0.07 (0.07) | 1.32 (0.08) | 8.76 | −0.03 (0.12) | 1.29 (0.14) | 8.33 | 0.68 (0.13) | 1.24 (0.16) | 9.60 | −0.65 (0.11) | 1.50 (0.14) | 8.00 |
| Lab test | −1.22 (0.07) | 0.95 (0.08) | 3.32 | −1.11 (0.12) | 1.03 (0.14) | 3.37 | −0.44 (0.13) | 0.97 (0.15) | 4.28 | −1.88 (0.11) | 1.01 (0.13) | 2.62 |
| Package Characteristics | ||||||||||||
| Label instruction | −2.09 (0.07) | 1.34 (0.08) | 1.46 | −2.05 (0.13) | 1.53 (0.13) | 1.40 | −1.11 (0.14) | 1.05 (0.14) | 2.40 | −2.85 (0.12) | 1.29 (0.13) | 1.02 |
| Label warning | −1.90 (0.07) | 1.17 (0.08) | 1.75 | −1.85 (0.13) | 1.34 (0.17) | 1.68 | −0.83 (0.13) | 1.31 (0.16) | 3.08 | −2.67 (0.12) | 1.04 (0.13) | 1.21 |
| Date of harvest | −1.20 (0.07) | −0.57 (0.10) | 3.37 | −1.14 (0.12) | −0.60 (0.15) | 3.27 | −0.62 (0.13) | 0.47 (0.18) | 3.69 | −1.72 (0.14) | −0.73 (0.13) | 3.03 |
| Package | −2.37 (0.07) | 1.33 (0.08) | 1.11 | −2.36 (0.13) | 1.06 (0.14) | 1.04 | −1.48 (0.13) | 1.25 (0.14) | 1.71 | −3.07 (0.12) | 1.24 (0.11) | 0.82 |
| Price and Free Sample | ||||||||||||
| Price | 0.21 (0.08) | 1.83 (0.09) | 10.77 | 0.30 (0.12) | 1.31 (0.14) | 10.54 | 0.53 (0.14) | 1.65 (0.17) | 8.72 | −0.29 (0.12) | 2.09 (0.14) | 10.75 |
| Free Sample | −1.74 (0.07) | 1.66 (0.08) | 2.04 | −1.47 (0.13) | 1.91 (0.16) | 2.41 | −1.17 (0.14) | 1.59 (0.16) | 2.26 | -2.38 (0.12) | 1.83 (0.14) | 1.61 |
| Store Characteristics | ||||||||||||
| Compliance to law | −0.87 (0.07) | 1.63 (0.08) | 4.52 | −0.67 (0.13) | 1.94 (0.16) | 4.96 | 0.05 (0.13) | 1.80 (0.16) | 6.28 | −1.85 (0.12) | 1.67 (0.13) | 2.68 |
| Staff | −0.86 (0.07) | 1.07 (0.08) | 4.54 | −0.80 (0.12) | 1.12 (0.14) | 4.44 | −0.19 (0.13) | 1.37 (0.16) | 5.23 | −1.43 (0.11) | −0.91 (0.13) | 3.97 |
| Distance | −1.38 (0.07) | 1.37 (0.08) | 2.85 | −1.11 (0.12) | 1.21 (0.14) | 3.37 | −0.77 (0.12) | 0.92 (0.16) | 3.24 | −1.99 (0.12) | 1.48 (0.13) | 2.35 |
| Store hours | −1.94 (0.07) | 1.19 (0.08) | 1.69 | −2.07 (0.125) | 1.32 (0.13) | 1.37 | −1.32 (0.13) | 0.90 (0.15) | 1.98 | −2.45 (0.12) | 0.96 (0.12) | 1.51 |
| Restrictions on Use | ||||||||||||
| Public use | −1.78 (0.07) | 1.51 (0.09) | 1.97 | −1.69 (0.13) | 1.64 (0.15) | 1.97 | −1.25 (0.14) | 1.39 (0.17) | 2.11 | −2.37 (0.12) | 1.82 (0.14) | 1.62 |
| Employer | −1.45 (0.07) | 1.82 (0.08) | 2.68 | −1.13 (0.12) | 2.00 (0.15) | 3.32 | −0.82 (0.14) | 1.74 (0.17) | 3.09 | −2.19 (0.12) | 1.88 (0.14) | 1.93 |
Notes:
The share of importance was calculated with formula , where a was the number of attributes shown per BWS task (in this study it was 4), “mean” was the coefficient mean of each attribute in hierarchical Bayesian estimation of mixed logit regressions, and b is a constant to make the sum of the share of importance to be 100.
Figure 1.
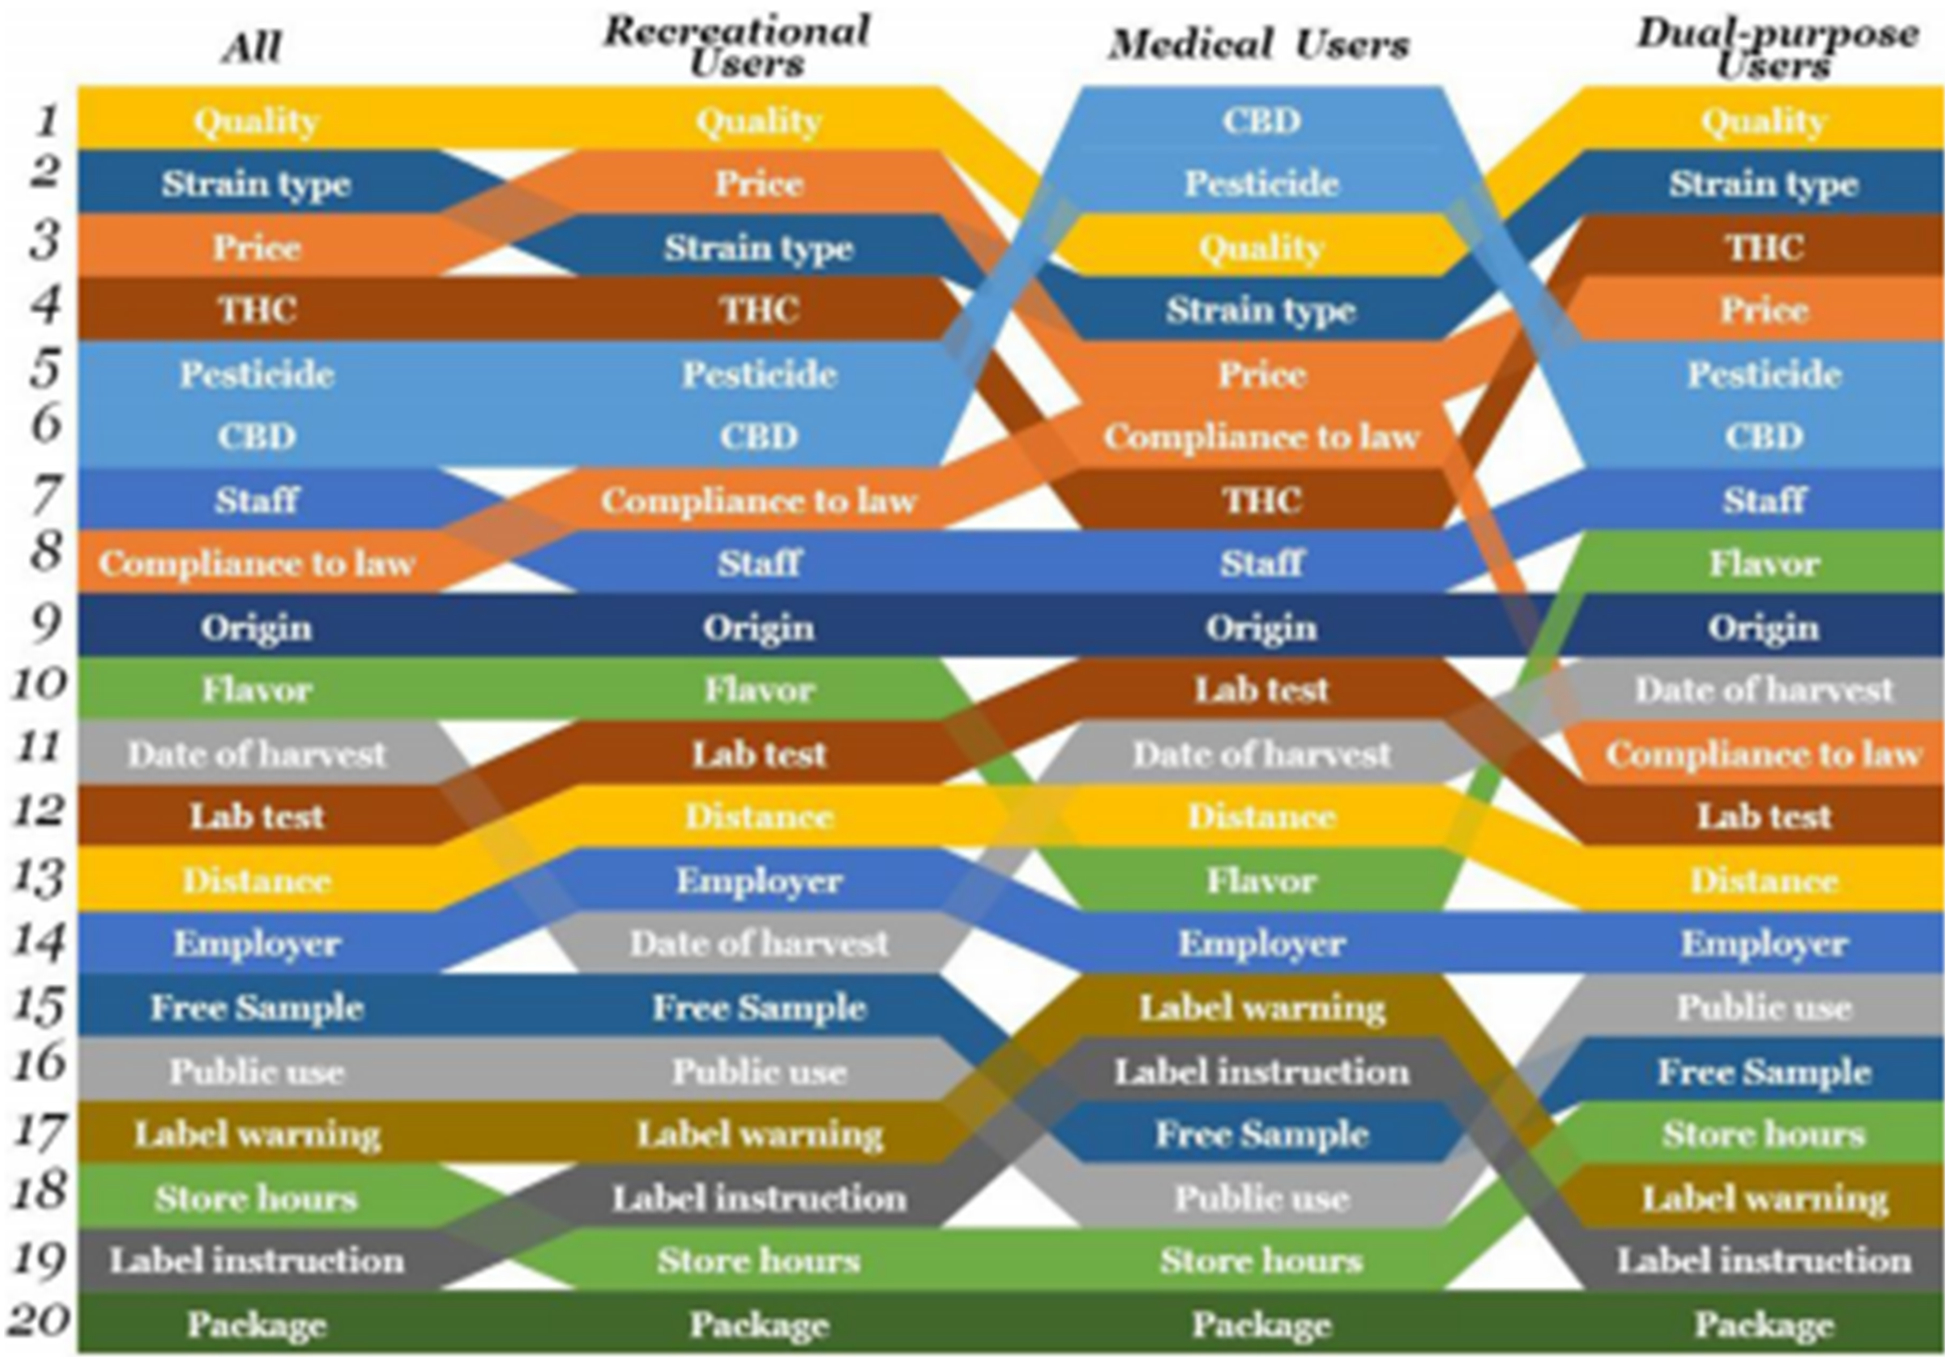
Ranking Flow Plot of the Shares of Importance of 20 Attributes (Full Sample and Subsamples by Cannabis Use Purposes)
In subsamples by cannabis use purposes (parameter estimations in Table 4 and ranking plot in Figure 1), users with different purposes shared similarities in the perceptions of attribute importance. For instance, ‘quality’, ‘price’, ‘strain type’, and ‘pesticide’ were included in the top five attributes and ‘package’ was perceived to be the least important in all the three subsamples. There were also heterogeneities. For instance, medical users perceived ‘CBD’ to be the most important attribute (ranked 1st, importance share 10.36%), whereas recreational and dual-purpose users placed less importance to ‘CBD’ (ranked 6th, importance share 5.09%; and ranked 6th, importance share 7.03%, respectively). Medical users also attached less importance to ‘THC’ (ranked 7th, importance share 6.04%) than recreational and dual-purpose users (ranked 4th, importance share 8.49%; and ranked 3rd, importance share13.47%, respectively).
In subsamples by gender (parameter estimations in Table S4 and ranking plot in Figure S3), females and males attached similar levels of importance to most attributes. Minor differences were noticed on the ranking of ‘label warning’ (19th in females and 16th in males) and ‘compliance to law’ (10th in females and 7th in males).
4. Discussion
This study innovatively adopted a BWS experiment to elicit cannabis consumers’ perceptions of the importance of 20 cannabis attributes in their purchase decision making in legal market. We found that some attributes were perceived to be more important than others, and cannabis users with different purposes exhibited heterogeneous perceptions.
It appears that intrinsic attributes overall tended to have larger allocations of importance than extrinsic attributes. The 12 intrinsic attributes out of the total 20 attributes accounted for over two thirds of the total importance and four out of the five most important attributes (‘quality’, 1st, ‘strain type’, 2nd, ‘THC’, 4th, ‘pesticide’, 5th) were intrinsic. It is not surprising that ‘quality’ received the first ranking as the important role of product quality in purchase intention has been recognized in marketing research in general. (Chang & Wildt, 1994; Tsiotsou, 2006) Despite limited scientific evidence, different categories of cannabis strains are believed and advertised to have different effects. (Ferguson, 2018) For instance, strains in Indica category are believed to have a more relaxing effect, whereas those in Sativa category are believed to have a more energizing effect. A study also suggested that consumers perceived different strains to be linked to different potency, price, and smoking interest. (Gilbert & DiVerdi, 2018) THC level in cannabis flowers has increased dramatically in the past decade, from 9% in 2008 to 17% in 2017. (Chandra, et al., 2019) A positive association was found between price and THC, (Smart, et al., 2017), indicating that consumers valued higher THC level in general. Pesticide contamination in cannabis products has been a long-standing public safety concern. (Bishop, 2017; Subritzky, Pettigrew, & Lenton, 2017) As cannabis remains a Schedule I drug by the US Controlled Substances Act, the Environmental Protection Agency could not fulfill its usual role of publishing pesticide usage guidelines for cannabis plants under the Federal Insecticide, Fungicide, and Rodenticide Act. (Bishop, 2017) Currently only half of the states approving cannabis retail sales have testing regulations and guide lists for pesticide use on cannabis, but these regulations and guide lists are still in development stage or lacking law enforcement.
Consumers in general attached less importance to extrinsic attributes. All the five least important attributes (‘package’, ‘label instruction’, ‘store hours’, ‘label waring’, ‘public use’) were extrinsic. Such findings were supported by an experimental study using stated preferences techniques, which also found limited impacts of product warnings on cannabis purchase decisions. (Shi, Cao, et al., 2019) However, there were a few extrinsic attributes perceived to be important. ‘Price’ was ranked as the 3rd important attribute, accounting for over 10% of the total importance. This was aligned with tobacco and alcohol literature, which consistently demonstrated high responsiveness of tobacco and alcohol use behaviors to changes in price. (Chaloupka, Powell, & Warner, 2019; Elder, et al., 2010; Wagenaar, Salois, & Komro, 2009; Wagenaar, Tobler, & Komro, 2010; Wilson, et al., 2012) The other two important attributes with a top 10 ranking were ‘staff’ (7th) and ‘compliance to law’ (8th). Dispensary staff played an important role in providing counseling and recommendations when novel strains and devices were rapidly emerging after cannabis legalization. (Haug, et al., 2016) In areas with weak law enforcement, dispensaries’ law compliance levels may be low. This may be appealing to consumers who seek to circumvent age verification and quantity limit.
Subsamples with different cannabis use purposes exhibited distinct perceptions, in line with previous epidemiology studies on the differences in sociodemographic characteristics and cannabis use patterns between recreational users and medical users. (Lankenau, et al., 2017; Lin, Ilgen, Jannausch, & Bohnert, 2016; Roy-Byrne, et al., 2015; Sznitman, 2017) It is not surprising that ‘THC’ was more preferred by recreational and dual-purpose users whereas ‘CBD’ was more preferred by medical users, because THC is the primary psychoactive compound getting people high (Hall & Degenhardt, 2009) and CBD is generally perceived having therapeutic effects without intoxication. Such difference was also observed in a previous experimental study with stated preferences techniques. (Shi, Cao, et al., 2019) Medical users also attached more importance to ‘pesticide’ and ‘compliance to law’, indicating that they were more inclined to pursue safe and responsible use of cannabis products.
Females were over-represented in our study sample, as commonly seen in online panels as a whole. (Shi, Cao, et al., 2019; Weinberg, Freese, & McElhattan, 2014). Although this reduces generalizability of our findings, it provides an opportunity to explore differences in perceptions by gender. In subsample analysis, we did not find dramatic differences between females and males, except that males placed slightly higher importance to ‘label warning’ and ‘compliance to law’ than females. This implies that female and male cannabis users may respond in a comparable manner to policy changes.
The findings of this study may inform cannabis regulation if the goal is to influence consumers’ purchase behaviors. Policy design, resource allocation, and law enforcement may be prioritized to regulating policy-modifiable attributes with greater perceived importance. For instance, policies aiming to modify intrinsic attributes, such as quality control, potency limit, pesticide test requirement, may have great potential to influence consumers’ purchase behaviors. Policy formulation targeting extrinsic attributes, such as increasing taxes, requiring staff training, and enforcing law compliance may also generate considerable impacts. In contrast, policy measures related to attributes with very low perceived importance, such as package and label requirements, limit on store hours, and public use ban, may not markedly change consumers’ purchase behaviors. It should be noted, however, that our study evaluated consumers’ perceived importance as an indicator of the potential responsiveness of their purchase behaviors to changes in policy-modifiable attributes. Even though the potential impacts of some low-importance attributes might be small, they may serve other important goals of cannabis regulation. For instance, requiring appropriate package may prevent incidental consumption by children, label instruction and label warnings may facilitate informed consumption and reduce risks of overdose and misuse, and banning public use may reduce exposure to secondhand smoke.
The study also suggested that policies should be designed with consideration in the heterogeneity of consumer differences by use purposes. For example, a potential policy setting lower or upper limit of CBD may generate larger impacts on medical users than recreational users and dual-purpose users, whereas increasing tax rates may yield larger impacts on recreational users who may be more sensitive to price changes. If a policy is being applied across the board to all types of users, policymakers should monitor possible disparities in purchase behaviors and related problem use. Meanwhile, our findings provide options to policymakers if the intention is to differentially impact users with different purposes. As medical use of cannabis has therapeutic effects yet recreational use of cannabis has medical and public health concerns in general, policymakers could intentionally use different strategies to promote medical use and control recreational use. An example is to impose higher tax rates on purchase for recreational purposes but lower tax rates on purchase for medical purposes.
The policy implications discussed in this study may not generalize directly to cannabis consumers in Uruguay or Canada, which has implemented different recreational cannabis supply models and regulatory strategies in different socioeconomic and epidemiological contexts. Nonetheless, the findings found in the US could serve as a benchmark for Uruguay and Canada to consider and compare while taking into account of their unique contexts. Furthermore, findings on medical users’ perceptions may inform cannabis regulations in a growing number of countries that have liberalized or considered liberalizing medical cannabis.
The strengths of the study included innovative use of BWS experiment, causal inferences at individual level, examination of a long list of attributes, exploration in the heterogeneity of the perceptions, and study of factors critical to cannabis retail sales when observational data are not yet available. Nonetheless, the study has limitations. First, the results only indicated “whether” an attribute was a relatively important factor in consumers’ purchase decision making, but “how” exactly the attribute would influence decision making or the direction of the association remains unknown. For example, we know from this study that ‘THC’ was an important factor, but we do not know if consumers preferred higher THC level or lower. Another example is ‘compliance to law’, which may either positively or negatively influence purchase decisions. Future research is warranted to examine the direction of the associations. Second, we examined “perceptions” in hypothetical scenarios instead of “behaviors” in the real world. How the perceived importance of these attributes would reflect consumers’ real-world purchase behaviors requires further examination. Third, we focused on the attributes relevant to cannabis flowers and excluded alternative forms of cannabis from consideration. As concentrates and edibles accounted for an increasing market share, more research is needed to examine consumers’ perceptions of factors critical to the purchase of these non-flower products. Fourth, we limited attributes to those relevant to legal products because they have potential to be modified by state or local cannabis policies. Whether and how policies regulating these attributes may have spillover effects on illegal markets are to be explored. Fifth, we derived the master list of attributes from existing literature, existing and potential cannabis, tobacco, and alcohol policies, and authors’ own experience and knowledge. The list was by no means to be exhaustive. Further, our study sample was recruited from convenience online panel and may not represent cannabis user population in the US. Particularly, the sample had insufficient representation of males and older adults, who had lower propensity to participate in online surveys probably due to time and access constraints. (Weinberg, et al., 2014) Representative samples are warranted in future research. Lastly, our study findings may not be generalizable to youth, whose perceptions may differ from adults.
5. Conclusion
Using a best-worst scaling experiment, this study found that cannabis users in general perceived ‘quality’, ‘strain type’, ‘price’, ‘THC’ and ‘pesticide’ to be important factors in cannabis purchase decisions. Recreational, medical, and dual-purpose users demonstrated heterogeneous allocations of importance to the attributes. The findings might deserve consideration in the design of cannabis control strategies, such as prioritizing policies that modify attributes with greater perceived importance and monitoring heterogeneous policy impacts in cannabis users with different purposes.
Supplementary Material
Funding
This research was supported by grant R01DA042290 (PI: Shi) from the US National Institute on Drug Abuse. This article is the sole responsibility of the authors and does not reflect the views the National Institute on Drug Abuse.
Footnotes
Declaration of Competing Interest
None
Supplementary materials
Supplementary material associated with this article can be found, in the online version, at doi:10.1016/j.drugpo.2020.102793.
References
- Aston ER, & Meshesha LZ (2020). Assessing Cannabis Demand: A Comprehensive Review of the Marijuana Purchase Task. Neurotherapeutics. [DOI] [PMC free article] [PubMed] [Google Scholar]
- Auger P, Devinney TM, & Louviere JJ (2007). Using best-worst scaling methodology to investigate consumer ethical beliefs across countries. J. Bus. Ethics, 70, 299–326. [Google Scholar]
- Aydelotte JD, Brown LH, Luftman KM, Mardock AL, Teixeira PGR, Coopwood B, & Brown CVR (2017). Crash fatality rates after recreational marijuana legalization in Washington and Colorado. Am. J. Public Health, 107, 1329–1331. [DOI] [PMC free article] [PubMed] [Google Scholar]
- BCC. Cannabis license search (2019). Available at https://cannabis.ca.gov/check_a_license/.Retrieved Nov 26th 2019.
- Bishop JH (2017). Weeding the garden of pesticide regulation: When the marijuana industry goes unchecked. Drake L. Rev 65, 223. [Google Scholar]
- Caputi TL, & Sabet KA (2018). Population-level analyses cannot tell us anything about individual-level marijuana-opioid substitution. Am. J. Public Health, 108, e12. [DOI] [PMC free article] [PubMed] [Google Scholar]
- CDOR (2019). Marijuana sales reports. Available at https://www.colorado.gov/pacific/revenue/colorado-marijuana-sales-reports. Retrieved Nov 26th 2019.
- Cerda M, Wall M, Feng T, Keyes KM, Sarvet A, Schulenberg J, O’Malley PM, Pacula RL, Galea S, & Hasin DS (2017). Association of state recreational marijuana laws with adolescent marijuana use. JAMA Pediatr. 171, 142–149. [DOI] [PMC free article] [PubMed] [Google Scholar]
- Chaloupka FJ, Powell LM, & Warner KE (2019). The use of excise taxes to reduce tobacco, alcohol, and sugary beverage consumption. Annu. Rev. Publ. Health, 40, 187–201. [DOI] [PubMed] [Google Scholar]
- Chandra S, Radwan MM, Majumdar CG, Church JC, Freeman TP, & ElSohly MA (2019). New trends in cannabis potency in USA and Europe during the last decade (2008–2017). Eur Arch Psychiatry Clin Neurosci, 269, 5–15. [DOI] [PubMed] [Google Scholar]
- Chang T-Z, & Wildt AR (1994). Price, product information, and purchase intention:An empirical study. J. Acad. Mark. Sci 22, 16–27. [Google Scholar]
- Croson R, & Gneezy U (2009). Gender differences in preferences. Journal of Economic Literature, 47, 448–474. [Google Scholar]
- Elder RW, Lawrence B, Ferguson A, Naimi TS, Brewer RD, Chattopadhyay SK, Toomey TL, & Fielding JE (2010). The effectiveness of tax policy interventions for reducing excessive alcohol consumption and related harms. Am. J. Prev. Med 38, 217–229. [DOI] [PMC free article] [PubMed] [Google Scholar]
- Enneking U, Neumann C, & Henneberg S (2007). How important intrinsic and extrinsic product attributes affect purchase decision. Food Qual. Prefer 18, 133–138. [Google Scholar]
- Erdem S, Rigby D, & Wossink A (2012). Using best-worst scaling to explore perceptions of relative responsibility for ensuring food safety. Food Policy, 37, 661–670. [Google Scholar]
- Ferguson S (2018) Beginner’s Guide to Marijuana Strains. Available at https://www.healthline.com/health/beginners-guide-to-marijuana-strains#1. Retrieved December 16 2019.
- Flynn TN, Louviere JJ, Peters TJ, & Coast J (2007). Best-worst scaling: What it can do for health care research and how to do it. J. Health Econ 26, 171–189. [DOI] [PubMed] [Google Scholar]
- Freisthler B, Gaidus A, Tam C, Ponicki WR, & Gruenewald PJ (2017). From medical to recreational marijuana sales: Marijuana outlets and crime in an era of changing marijuana legislation. J. Prim. Prev 38, 249–263. [DOI] [PMC free article] [PubMed] [Google Scholar]
- Gilbert AN, & DiVerdi JA (2018). Consumer perceptions of strain differences in Cannabis aroma. PLoS One, 13, e0192247. [DOI] [PMC free article] [PubMed] [Google Scholar]
- Goodman S, Leos-Toro C, & Hammond D (2019). The impact of plain packaging and health warnings on consumer appeal of cannabis products. Drug Alcohol Depend, 205, 107633. [DOI] [PubMed] [Google Scholar]
- Hall W, & Degenhardt L (2009). Adverse health effects of non-medical cannabis use.Lancet, 374, 1383–1391. [DOI] [PubMed] [Google Scholar]
- Hansen B, Miller K, & Weber C (2018). Early evidence on recreational marijuana legalization and traffic fatalities. Econ. Inq. 10.1111/ecin.12751. [DOI] [Google Scholar]
- Harris AHS, Humphreys K, & Finney JW (2015). State-level relationships cannot tell us anything about individuals. Am. J. Public Health, 105 E8–E8. [DOI] [PMC free article] [PubMed] [Google Scholar]
- Haug NA, Kieschnick D, Sottile JE, Babson KA, Vandrey R, & Bonn-Miller MO (2016). Training and Practices of Cannabis Dispensary Staff. Cannabis Cannabinoid Res, 1, 244–251. [DOI] [PMC free article] [PubMed] [Google Scholar]
- Hendriks A, Wijnen B, van Engelen R, Conde R, Evers SM, Gonzalez J, Govers M, Muhlbacher A, & Hiligsmann M (2018). A best-worst scaling in Colombian patients to rank the characteristics of HIV/AIDS treatment. J. Med. Econ 21, 468–473. [DOI] [PubMed] [Google Scholar]
- Kerr DCR, Bae H, Phibbs S, & Kern AC (2017). Changes in undergraduates’ marijuana, heavy alcohol and cigarette use following legalization of recreational marijuana use in Oregon. Addiction, 112, 1992–2001. [DOI] [PubMed] [Google Scholar]
- Lagerkvist CJ (2013). Consumer preferences for food labelling attributes: Comparing direct ranking and best-worst scaling for measurement of attribute importance, preference intensity and attribute dominance. Food Qual. Prefer 29, 77–88. [Google Scholar]
- Lankenau SE, Fedorova EV, Reed M, Schrager SM, Iverson E, & Wong CF (2017). Marijuana practices and patterns of use among young adult medical marijuana patients and non-patient marijuana users. Drug Alcohol Depend. 170, 181–188. [DOI] [PMC free article] [PubMed] [Google Scholar]
- Leos-Toro C, Fong GT, Meyer SB, & Hammond D (2019). Perceptions of effectiveness and believability of pictorial and text-only health warning labels for cannabis products among Canadian youth. Int J Drug Policy, 73, 24–31. [DOI] [PubMed] [Google Scholar]
- Leos-Toro C, Fong GT, Meyer SB, & Hammond D (2020). Cannabis labelling and consumer understanding of THC levels and serving sizes. Drug Alcohol Depend 107843. [DOI] [PubMed] [Google Scholar]
- Lin LA, Ilgen MA, Jannausch M, & Bohnert KM (2016). Comparing adults who use cannabis medically with those who use recreationally: Results from a national sample. Addict. Behav 61, 99–103. [DOI] [PMC free article] [PubMed] [Google Scholar]
- Louviere J, Lings I, Islam T, Gudergan S, & Flynn T (2013). An introduction to the application of (case 1) best–worst scaling in marketing research. Int. J. Res. Mark, 30, 292–303. [Google Scholar]
- Marley AAJ, & Louviere JJ (2005). Some probabilistic models of best, worst, and best-worst choices. J. Math. Psychol 49, 464–480. [Google Scholar]
- McFadden D (1973). Conditional logit analysis of qualitative choice behavior. In Zarembka P (Ed.). Frontiers in Econometrics (pp. 105–142). New York: Academic Press. [Google Scholar]
- McFadden D, & Train K (2000). Mixed MNL models for discrete response. J. Appl. Econom 15, 447–470. [Google Scholar]
- Mcgreevy P (2019). California now has the biggest legal marijuana market in the world. Its black market is even bigger. Available at https://www.latimes.com/california/story/2019-08-14/californias-biggest-legal-marijuana-market. In Los Angeles Times. Sancramento, CA. [Google Scholar]
- Meyers-Levy J, & Loken B (2015). Revisiting gender differences: What we know and what lies ahead. Journal of Consumer Psychology, 25, 129–149. [Google Scholar]
- Mutti-Packer S, Collyer B, & Hodgins DC (2018). Perceptions of plain packaging and health warning labels for cannabis among young adults: findings from an experimental study. BMC Public Health, 18, 1361. [DOI] [PMC free article] [PubMed] [Google Scholar]
- NCSL (2018). Marijuana overview. Available at http://www.ncsl.org/research/civil-and-criminal-justice/marijuana-overview.aspx. Retrieved Nov 6th 2019
- Orens A, Light M, Lewandowski B, Rowberry J, & Saloga C (2018). Market size and demand for marijuana in Colorado 2017 market update. Available at https://www.colorado.gov/pacific/sites/default/files/MED%20Demand%20and%20Market%20%20Study%20%20082018.pdf. In: Marijuana Policy Group. [Google Scholar]
- Pacula RL, Kilmer B, Wagenaar AC, Chaloupka FJ, & Caulkins JP (2014). Developing public health regulations for marijuana: lessons from alcohol and tobacco. Am. J. Public Health, 104, 1021–1028. [DOI] [PMC free article] [PubMed] [Google Scholar]
- Johnson, Reed F, Lancsar E, Marshall D, Kilambi V, Muhlbacher A, Regier A,D, Bresnahan BW, Kanninen B, & Bridges JF (2013). Constructing experimental designs for discrete-choice experiments: report of the ISPOR Conjoint Analysis Experimental Design Good Research Practices Task Force. Value Health, 16, 3–13. [DOI] [PubMed] [Google Scholar]
- Roy-Byrne P, Maynard C, Bumgardner K, Krupski A, Dunn C, West II, Donovan D, Atkins DC, & Ries R (2015). Are medical marijuana users different from recreational users? The view from primary care. Am. J. Addict 24, 599–606. [DOI] [PubMed] [Google Scholar]
- Shi Y, Cao Y, Shang C, & Pacula RL (2019). The impacts of potency, warning messages, and price on preferences for Cannabis flower products. Int. J. Drug Policy, 74, 1–10. [DOI] [PMC free article] [PubMed] [Google Scholar]
- Shi Y, & Liang D (2020). The Association between Recreational Cannabis Commercialization and Cannabis Exposures Reported to the US National Poison Data System. Addiction. [DOI] [PMC free article] [PubMed] [Google Scholar]
- Shi Y, Liang D, Bao Y, An R, Wallace MS, & Grant I (2019). Recreational marijuana legalization and prescription opioids received by Medicaid enrollees. Drug Alcohol Depend. 194, 13–19. [DOI] [PMC free article] [PubMed] [Google Scholar]
- Smart R, Caulkins JP, Kilmer B, Davenport S, & Midgette G (2017). Variation in cannabis potency and prices in a newly legal market: evidence from 30 million cannabis sales in Washington state. Addiction, 112, 2167–2177. [DOI] [PMC free article] [PubMed] [Google Scholar]
- Subritzky T, Pettigrew S, & Lenton S (2017). Into the void: Regulating pesticide use in Colorado’s commercial cannabis markets. Int J Drug Policy, 42, 86–96. [DOI] [PubMed] [Google Scholar]
- Sznitman SR (2017). Do recreational cannabis users, unlicensed and licensed medical cannabis users form distinct groups. Int. J. Drug Policy, 42, 15–21. [DOI] [PubMed] [Google Scholar]
- Thurstone LL (1927). A law of comparative judgment. Psychological review, 34, 273. [Google Scholar]
- Tsiotsou R (2006). The role of perceived product quality and overall satisfaction on purchase intentions. Int. J. Consum. Stud 30, 207–217. [Google Scholar]
- Wagenaar AC, Salois MJ, & Komro KA (2009). Effects of beverage alcohol price and tax levels on drinking: a meta-analysis of 1003 estimates from 112 studies. Addiction, 104, 179–190. [DOI] [PubMed] [Google Scholar]
- Wagenaar AC, Tobler AL, & Komro KA (2010). Effects of alcohol tax and price policies on morbidity and mortality: a systematic review. Am. J. Public Health, 100, 2270–2278. [DOI] [PMC free article] [PubMed] [Google Scholar]
- Weinberg JD, Freese J, & McElhattan D (2014). Comparing data characteristics and results of an online factorial survey between a population-based and a crowdsource-recruited sample. Sociological Science, 1, 292–310. [Google Scholar]
- Wilson LM, Tang, Avila E, Chander G, Hutton H,E, Odelola OA, Elf JL,Heckman-Stoddard BM, Bass EB, Little EA, Haberl EB, & Apelberg BJ (2012). Impact of tobacco control interventions on smoking initiation, cessation, and prevalence: a systematic review. J Environ Public Health, 2012, 961724. [DOI] [PMC free article] [PubMed] [Google Scholar]
- WSLCB (2019). Washington marijuana dashboard. Available at https://data.lcb.wa.gov/stories/s/WSLCB-Marijuana-Dashboard/hbnp-ia6v/. Retrieved Nov 26th 2019.
Associated Data
This section collects any data citations, data availability statements, or supplementary materials included in this article.