Fig. 11.

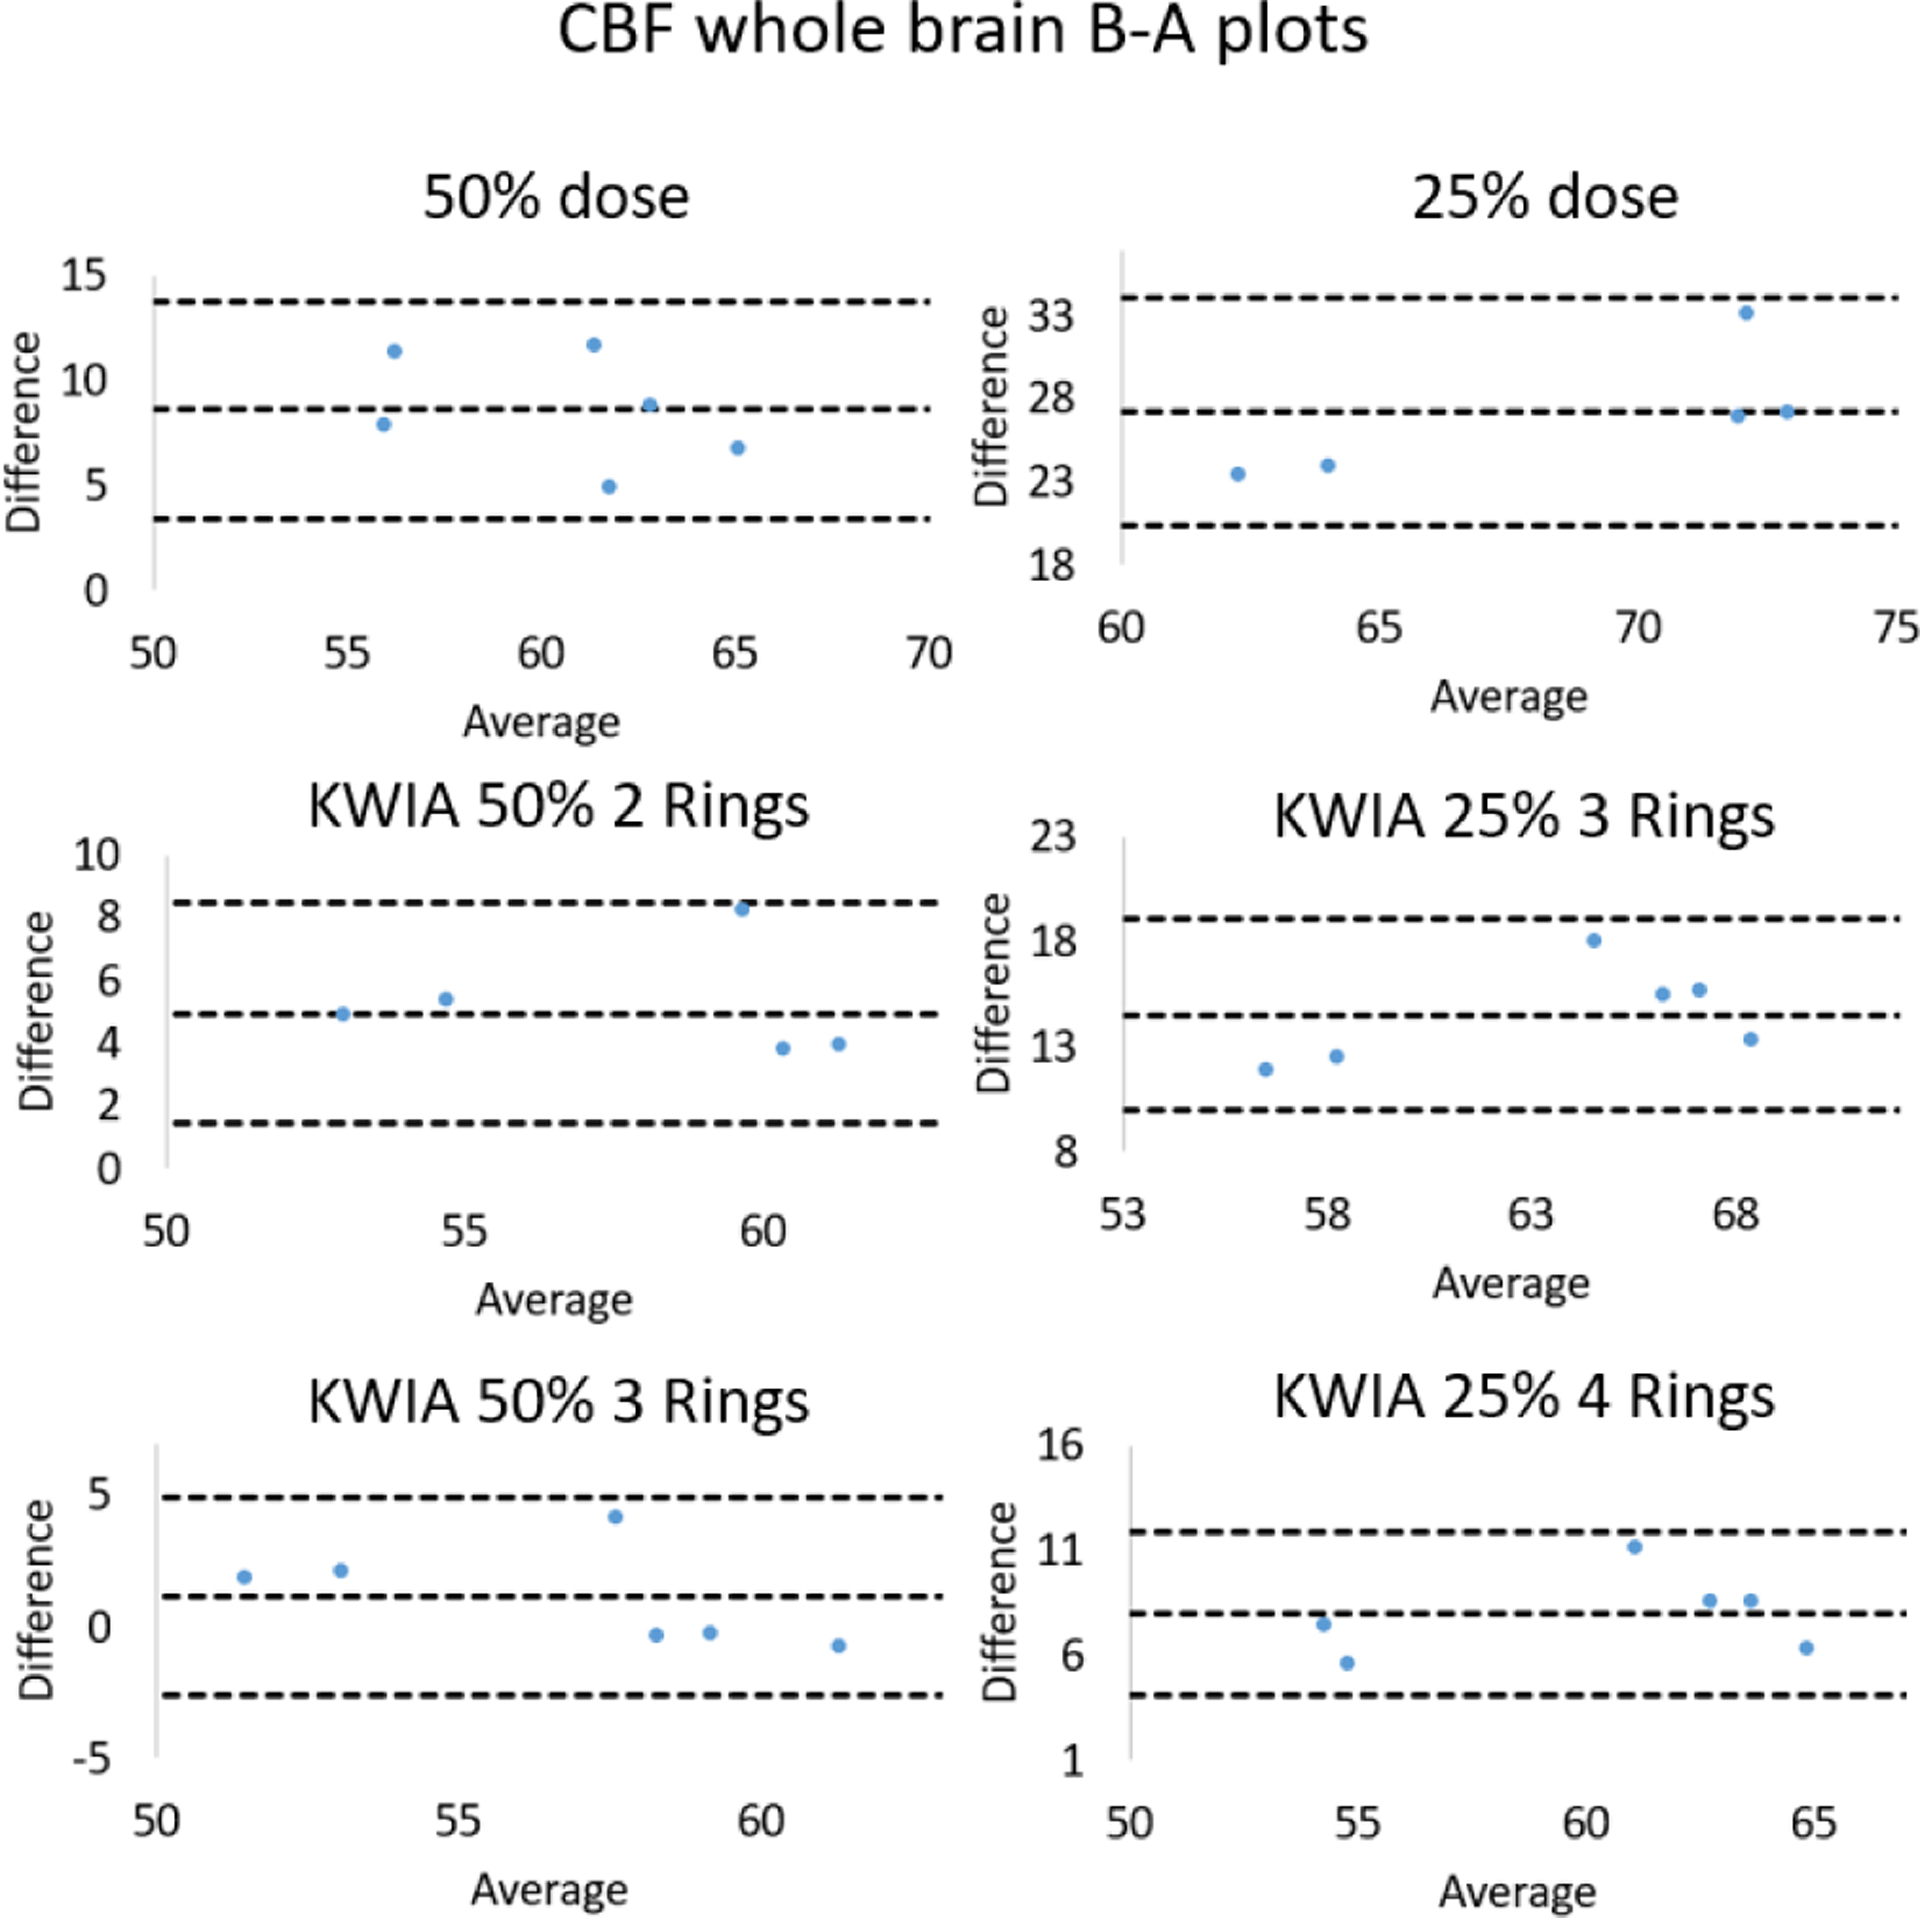
Bland-Altman plots for comparisons of whole brain CBF values measured between full dose and low dose conditions as well as low dose with KWIA reconstructions.

Bland-Altman plots for comparisons of whole brain CBF values measured between full dose and low dose conditions as well as low dose with KWIA reconstructions.