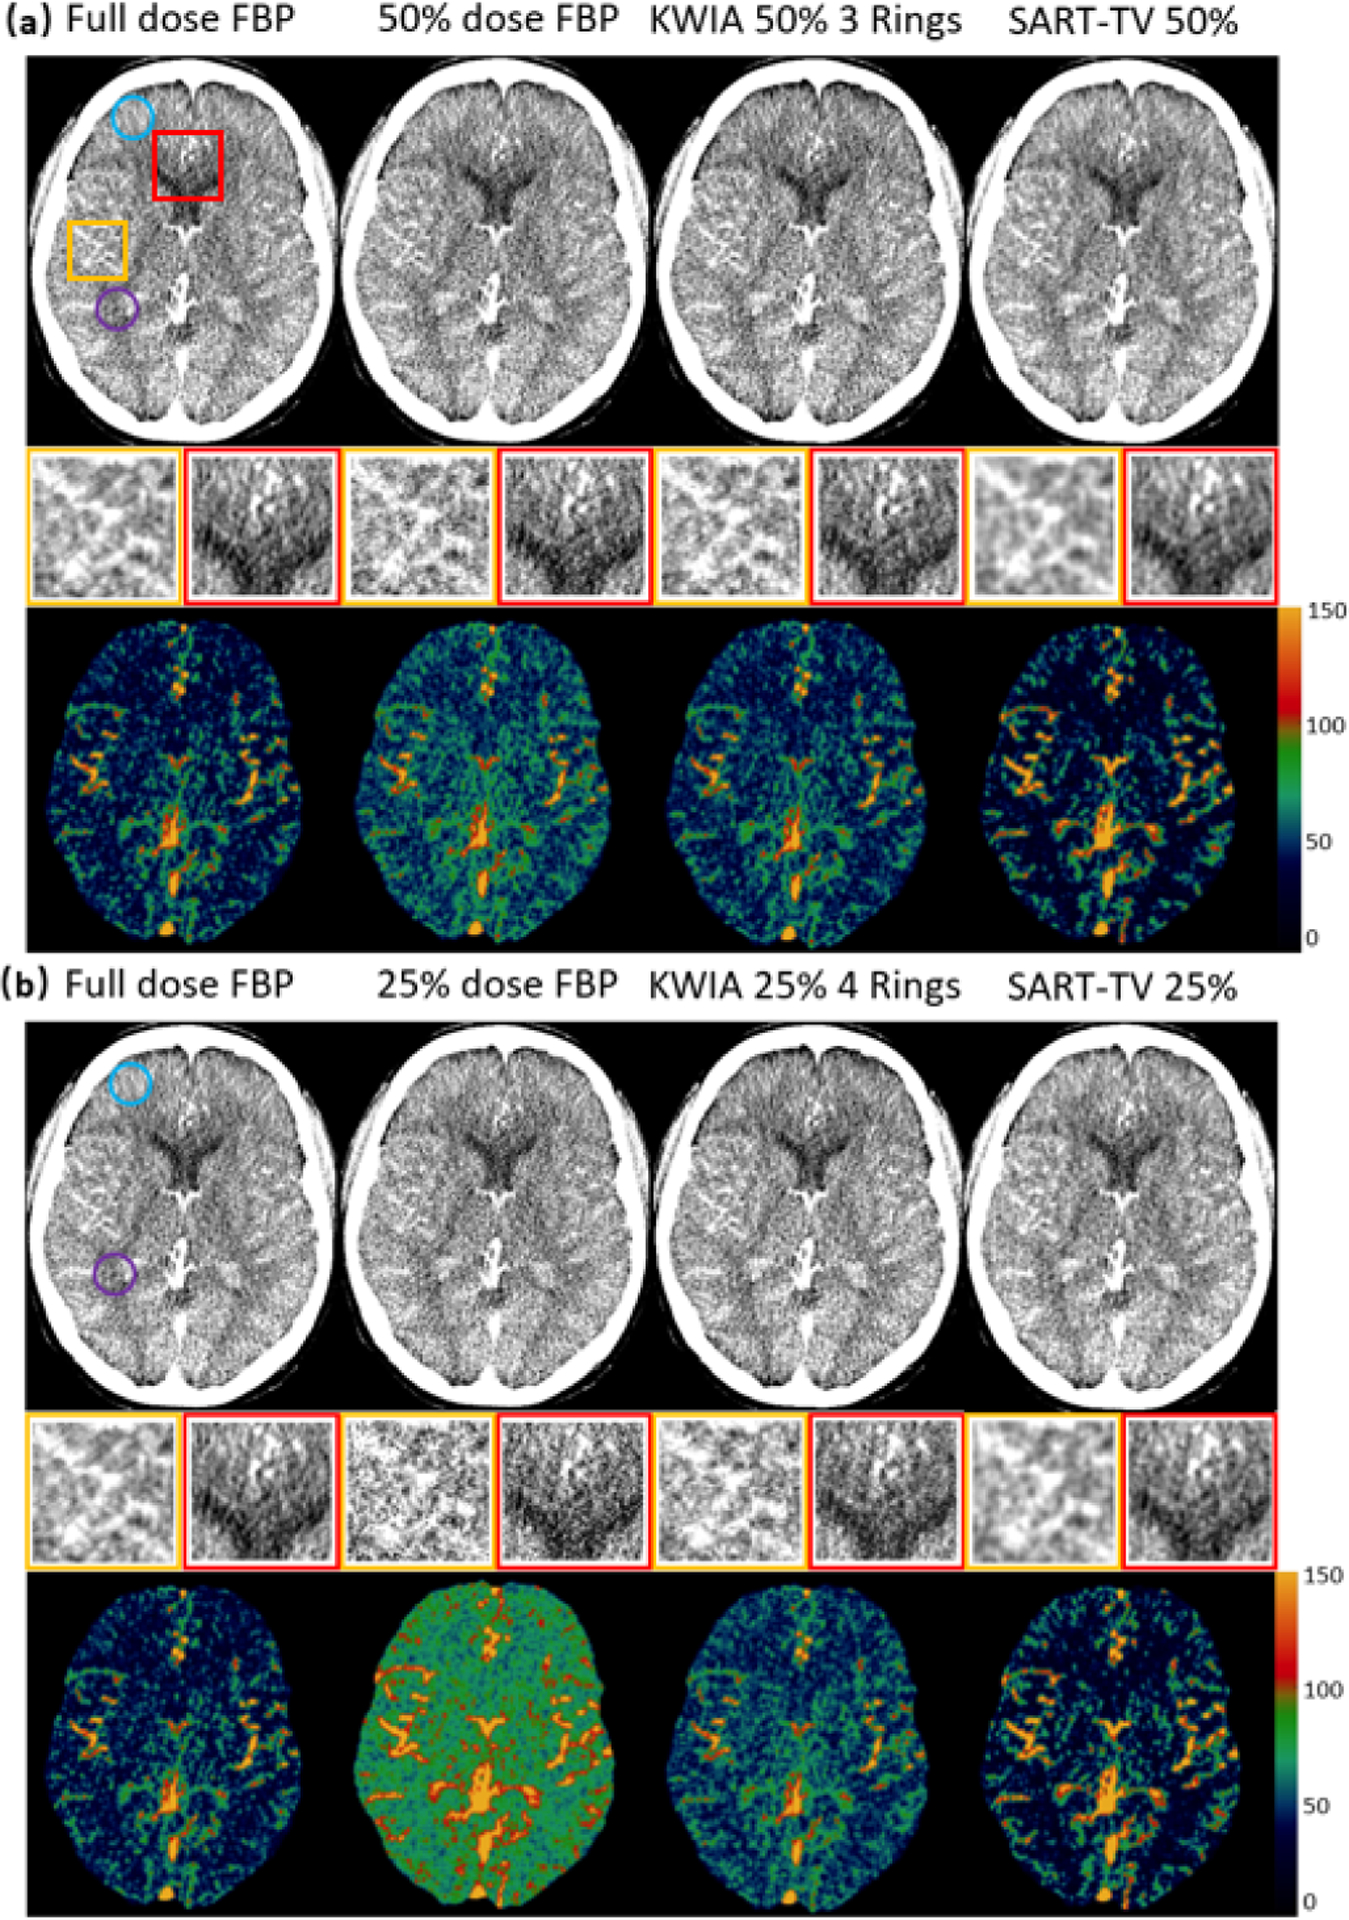
Fig. 12.

Reconstructed images (top row of (a) and (b)) and CBF maps (bottom row of (a) and (b)) with full dose FBP, 50% dose FBP, 25% dose FBP, KWIA 50% 3 Rings, KWIA 25% 4 Rings, 50% dose SART-TV, and 25% dose SART-TV. Insets with magnified regions of images show SNR and spatial smoothness of each reconstruction method.
