
Fig. 2.
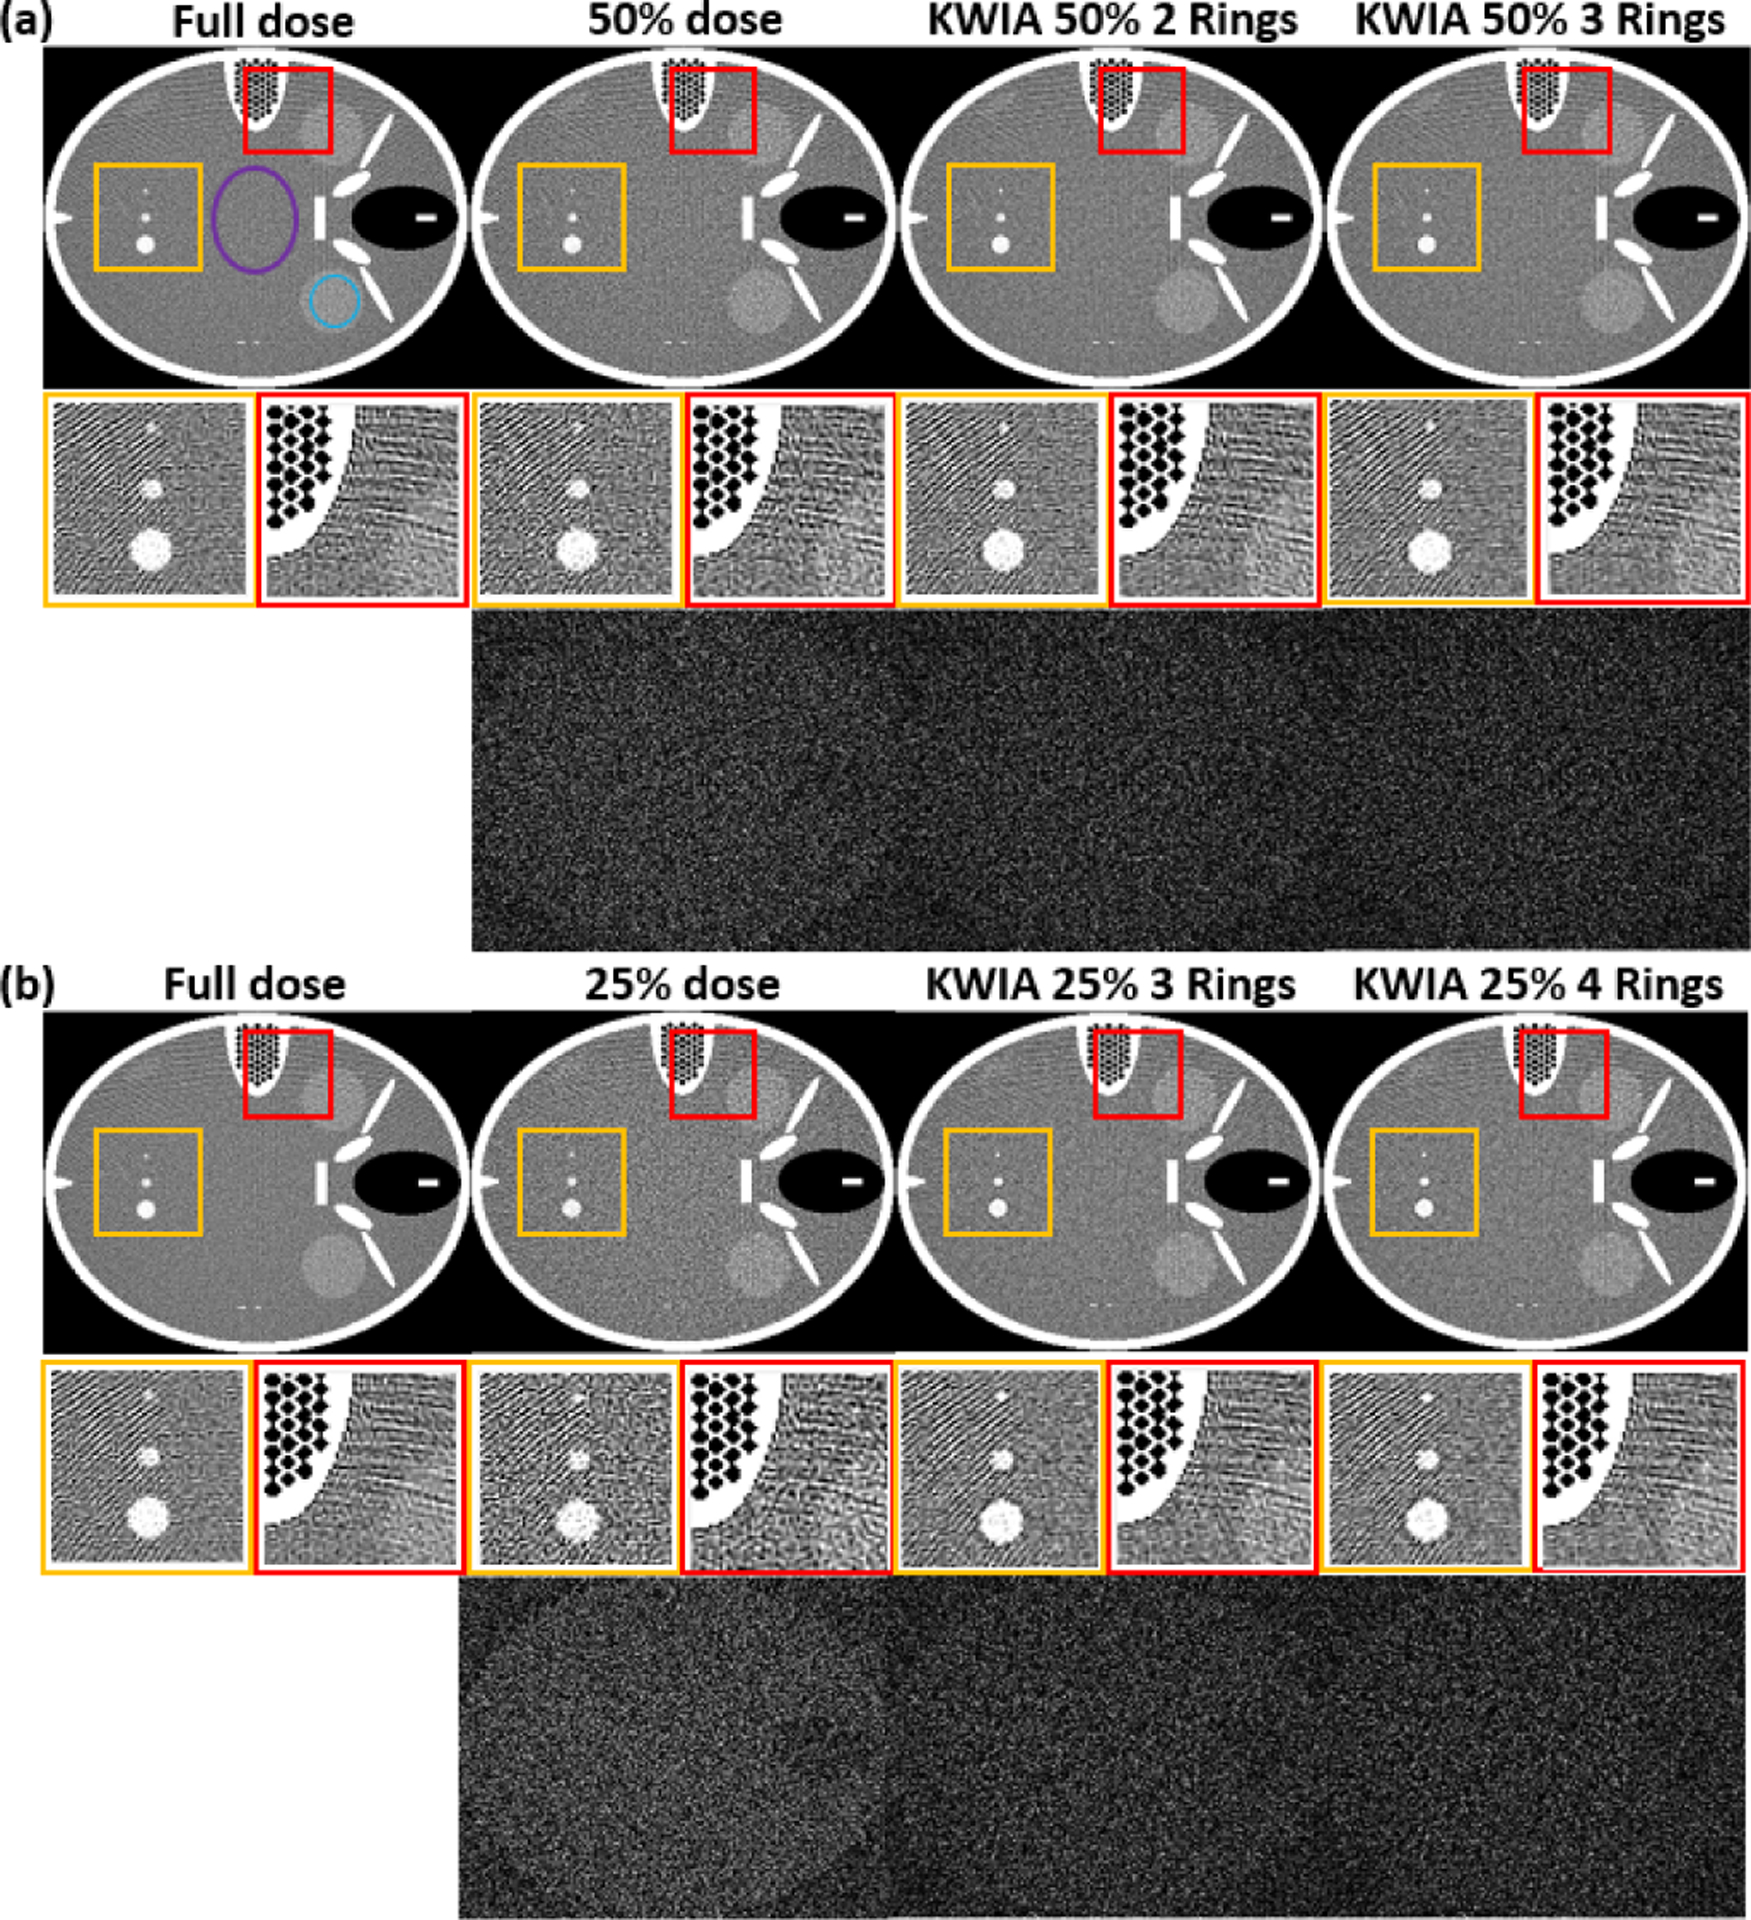
FORBILD CT phantom with 3 vessels of different sizes. (a) and (b) contains the full dose, low dose simulation, and 4 KWIA simulation results. Two ROI were enlarged to emphasize SNR change. And subtraction images (window level and window center were adjusted for visual observation) were made to show the structural change.