Fig. 5.

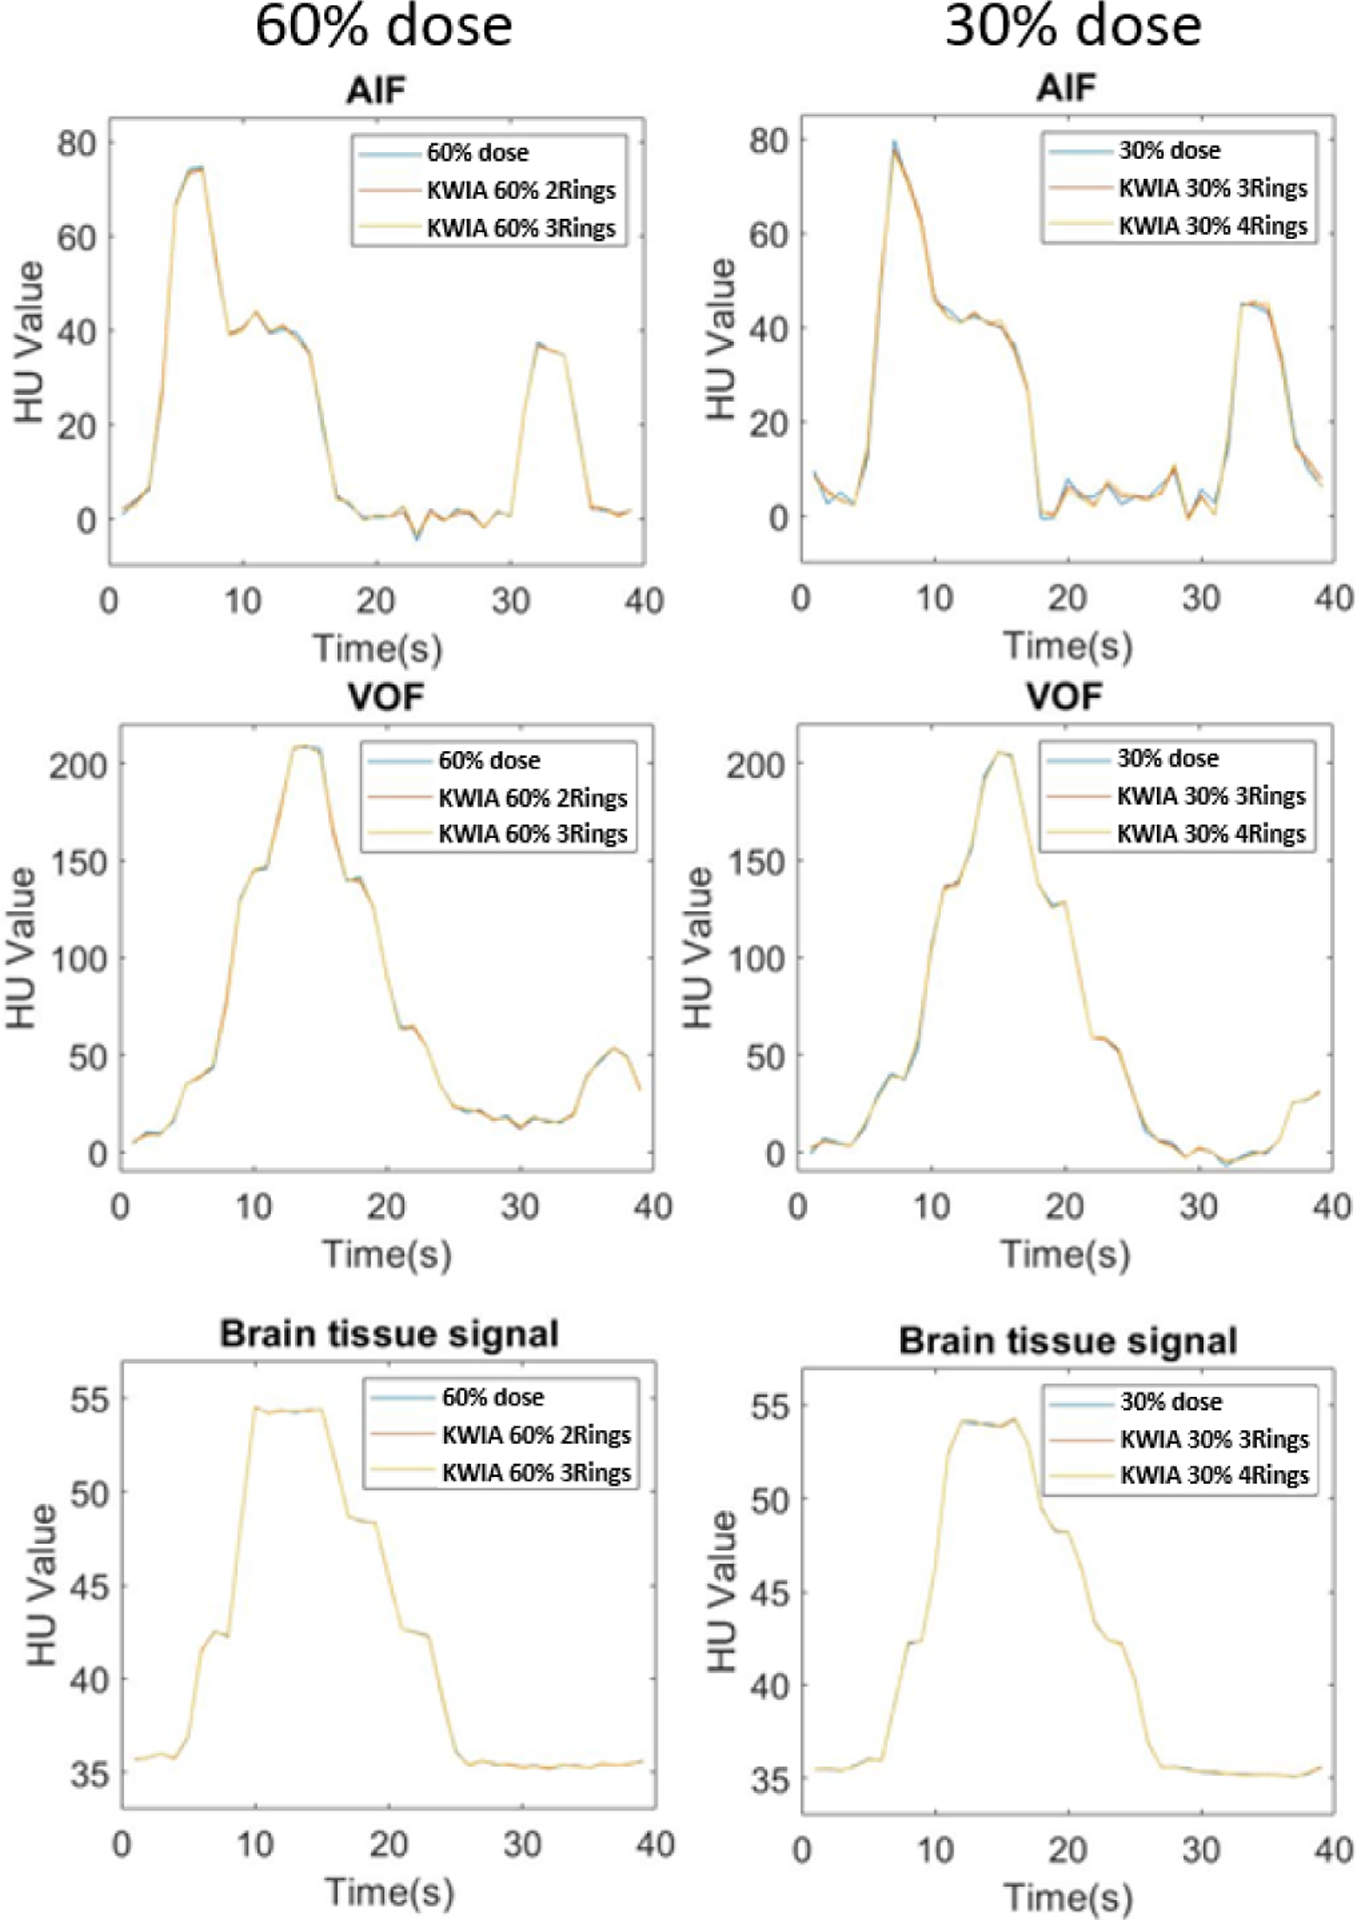
AIF, VOF and brain tissue signal curves of full dose and low dose images reconstructed with KWIA. No apparent difference can be observed all curves. The second peaks in AIF and VOF represent the second-pass of contrast bolus.

AIF, VOF and brain tissue signal curves of full dose and low dose images reconstructed with KWIA. No apparent difference can be observed all curves. The second peaks in AIF and VOF represent the second-pass of contrast bolus.