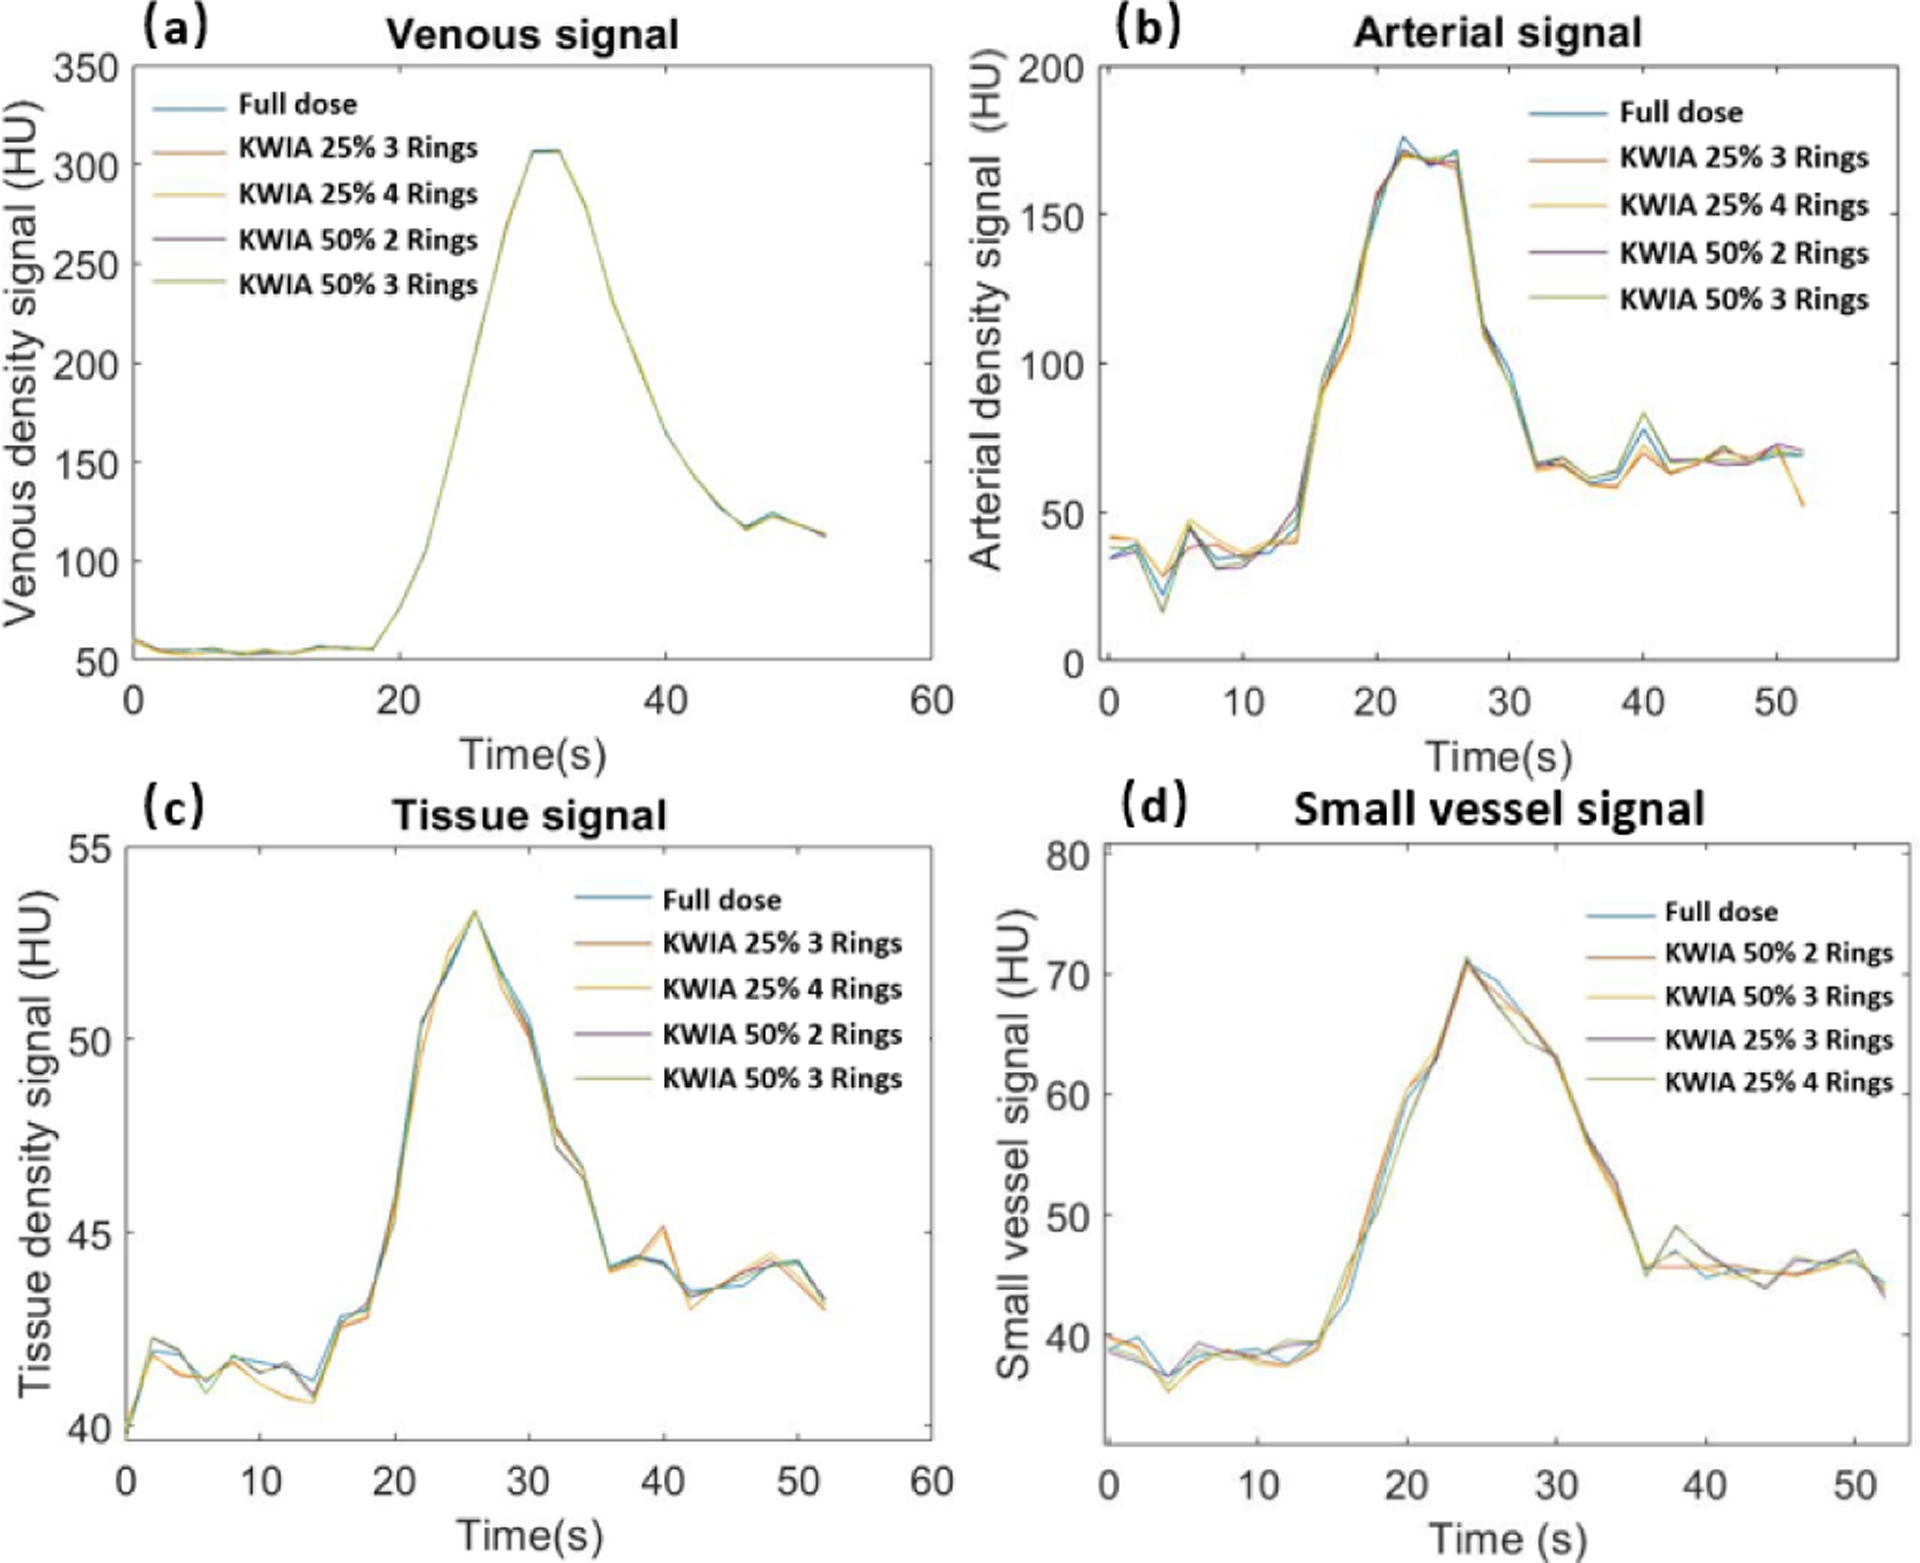
Fig. 9.

Dynamic contrast curves for venous (a), arterial (b), tissue ROI (c), and an about 1 mm wide small vessel (d) of full dose case and KWIA simulation cases. No apparent differences can be observed in all 4 signals. In arterial, tissue, and the small vessel signals, KWIA simulation with 25% dose reduction tends to have a greater difference than KWIA simulation with 50% dose reduction.
