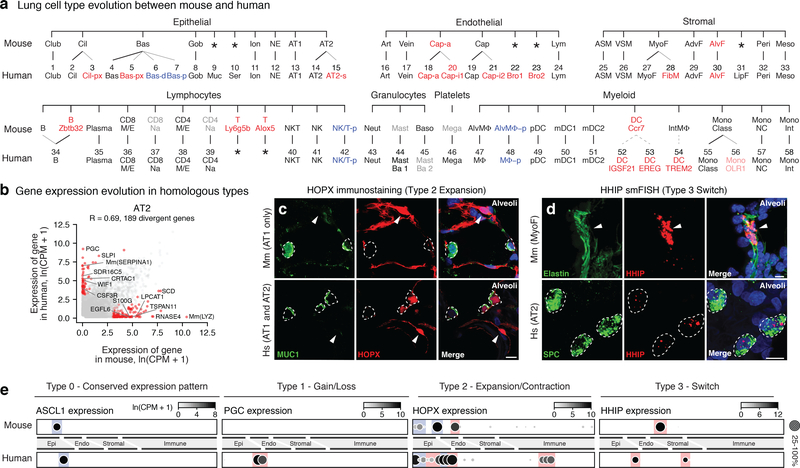
Figure 4. Evolutionary divergence of lung cell types and expression patterns.
a, Mouse (top) lung molecular cell types (profiled and identified as for human, see Methods) aligned with homologous human types (bottom, Figs. 2a, 3a) by expression of classical markers in Supplementary Table 6. Thin lines, evolutionary expansions; dashed lines, potential expansions of functionally-related types. Red text, newly identified populations (light red, identified in only one subject); blue, cell states more abundant in human; gray, extant mouse cell types not captured in our data or found in only one patient in human; *, missing cell types. b, Scatter plot comparing average expression levels (dots) in AT2 cells of each expressed human gene and mouse ortholog (SS2 datasets; n, 3,404 human and 318 mouse AT2 cells). R, Pearson correlation coefficient. Red dots, divergent genes (selected ones indicated) expressed 20-fold higher in either species, p<0.05 (‘MAST’ differential gene expression test). Scale, ln(CPM+1). c, Alveolar sections from mouse (top, Mm) and human (bottom, Hs) immunostained for HOPX (red) and AT2 marker MUC1 (green), and DAPI (blue). HOPX is expressed selectively in AT1 cells (arrowheads) in mouse but in human expression has expanded to AT2 and AT2-s cells (dashed circles). Bars, 10μm. Staining repreated on 3 subjects and mice. d, Alveolar sections from mouse (top) and human (bottom) probed by smFISH for Hhip and HHIP (red) and hydrazide staining for myofibroblast marker elastin (green) in mouse and smFISH for AT2 marker SFTPC (green) in human. Note HHIP expression switch from myofibroblast (mouse, arrowhead) to AT2 cells (human, dashed circles). Bars, 10μm. Staining repreated on 3 human subjects and mice. e, Dot plots of expression (SS2 datasets) of homologous genes indicated in mouse and human lung cell types (ordered as in panel a) exemplifying the four observed scenarios (Type 0,1,2,3) for evolution of cellular expression pattern. Colors highlight cell types with conserved (blue) and diverged (red) expression. For more details on statistics and reproducibility, please see Methods.

