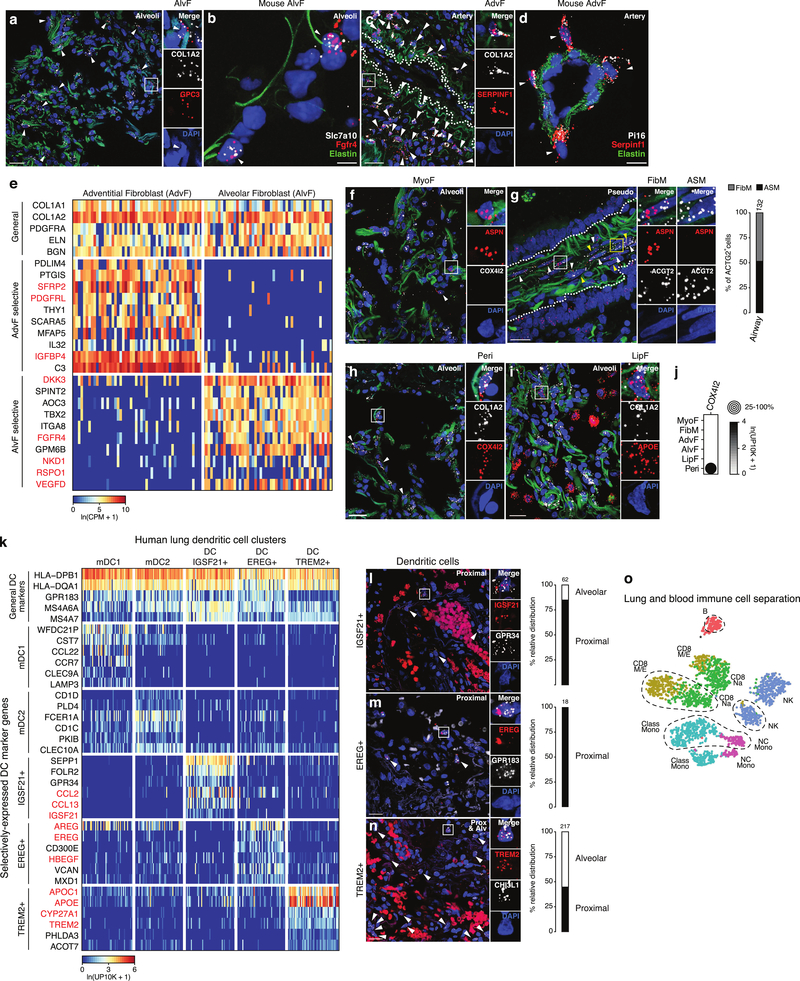
Extended Data Figure 4. Markers and lung localization of stromal and dendritic subtypes.
(a-d) smFISH for RNA of indicated marker genes of alveolar fibroblasts (AlvF, a, b) and adventitial fibroblasts (AdvF, c, d) in adult human (a, c) and mouse (b, e) alveolar (a, b) and pulmonary artery (c, d) sections. ECM autofluorescence (green, panels a, c) to show blood vessels; Elastin (green, panels b, d); DAPI counterstain (blue, all panels). Staining repeated on 2 human subjects or 3 mice. a, smFISH probes: general fibroblast marker COL1A2 (white) and AlvF-selective marker GPC3 (red). Arrowheads, AlvF cells. Inset, close-up of boxed region showing merged (top) and split channels of an AlvF. Bars, 20 μm (inset 60 μm). b, smFISH probes: AlvF-selective markers Slc7a10 (white) and Frfr4 (red). Elastin (green) shows alveolar entrance ring. Arrowheads, AlvF cells. Bar, 5 μm. c, smFISH probes: general fibroblast marker COL1A2 (white) and AdvF-selective marker SERPINF1 (red). AdvF (some indicated with arrowheads) localize around blood vessels (ECM, green). Inset, close-up of boxed region showing merged (top) and split channels of an AdvF. Dashed line, artery boundary. Bars, 30 μm (inset 90 μm). d, smFISH probes: AdvF-selective markers Pi16 (white) and Serpinf1 (red). AdvF (arrowheads) surround artery (marked by Elastin, green). Bar, 10 μm. e, Heatmap of expression of representative general, adventitial-selective, and alveolar-selective fibroblast markers in 50 randomly-selected cells from AdvF (left) and AlvF (right) clusters (SS2 dataset). Note specialization (highlighted red) in growth factors (AdvF: PDGFRL, IGFBP4; AlvF: FGFR4, VEGFD) and morphogen (AdvF: SFRP2; AlvF: NKD1, DKK3) signaling/regulation. f, g, smFISH and quantification of cell abundance in human alveolar (Alveoli, f) and pseudostratified epithelial airway (Pseudo, g) sections probed for myofibroblast (MyoF) and fibromyocyte marker ASPN (red), and for fibromyocyte (FibM) and airway smooth muscle (ASM) markers COX4I2 (white, f) and ACTG2 (white, g). ECM autofluorescence, green; DAPI counter stain, blue. Inset (f), boxed region showing close-up of merged (top) and split channels of ASPN+ COX4I2− myofibroblast. Myofibroblasts and fibromyocytes (see below) likely make up remaining cells in Figure 1f quantification. Inset (g), boxed regions showing close-up of merged (top) and split channels of FibM (white box) and ASM (yellow box) cells. FibM (white arrowheads) and ASM (yellow arrowheads) are intermingled in wall of pseudostratified airway (dotted outline). Staining repeated on 2 subjects. h, i, smFISH of human alveolar sections probed for general stromal marker COL1A2 (white), pericyte (Peri) marker COX4I2 (red, panel h), lipofibroblast (LipF) marker APOE (red, panel i). ECM autofluorescence, green; DAPI counter stain, blue. Inset (h), boxed region showing close-up of pericyte. Inset (i), boxed region showing close-up of COL1A2 APOE double-positive LipF. LipF cells are intermingled among other stromal cells (single-positive COL1A2) and macrophages (single-positive APOE). Quantification in Fig. 1f. Bars, 20 μm. Staining repeated on 2 subjects. j, Dot plot of COX4I2 expression in alveolar stromal cell types (10x dataset). k, Heatmap of expression of dendritic cell marker genes in 50 randomly-selected cells from indicated dendritic cell clusters (human blood and lung 10x datasets). Cells in all clusters express general dendritic markers including antigen presenting genes but each cluster also has its own selective markers. Red-highlighted markers distinguishing the newly-identified dendritic cell clusters (IGSF21+, EREG+, TREM2+) suggest different roles in asthma (IGSF21+), growth factor regulation (EREG+), and lipid handling (TREM2+). l-n, smFISH of adult human lung proximal and alveolar (Alv) sections as indicated probed for IGSF21+ DC markers IGSF21 (red) and GPR34 (white) (panel l), EREG+ DC marker EREG (red) and general DC marker GPR183 (white) (panel m), and TREM2+ DC markers TREM2 (red) and CHI3L1 (white) (panel n). DAPI counter stain, blue. (Non-punctate signal in red channel (panels l, n) is erythrocyte autofluorescence. Insets, boxed regions showing merged and split channels of close-up of single dendritic cell of indicated type. Bars, 20 μm. Arrowheads, double-positive cells. Quantification shows distribution of each dendritic type; note IGSF21+ and EREG+ dendritic cells show strong proximal enrichment. Staining repeated on 2 subjects. o, tSNE of expression profile clusters of monocytes and B, T, and NK cells (10x dataset, subject 1, 2,622 cells). Note separate cell clusters of each immune cell type isolated from lung (no outline) and blood (dashed outline). Asterisk, small number of B cells isolated from the lung that cluster next to blood B cells. For more details on statistics and reproducibility, please see Methods.

