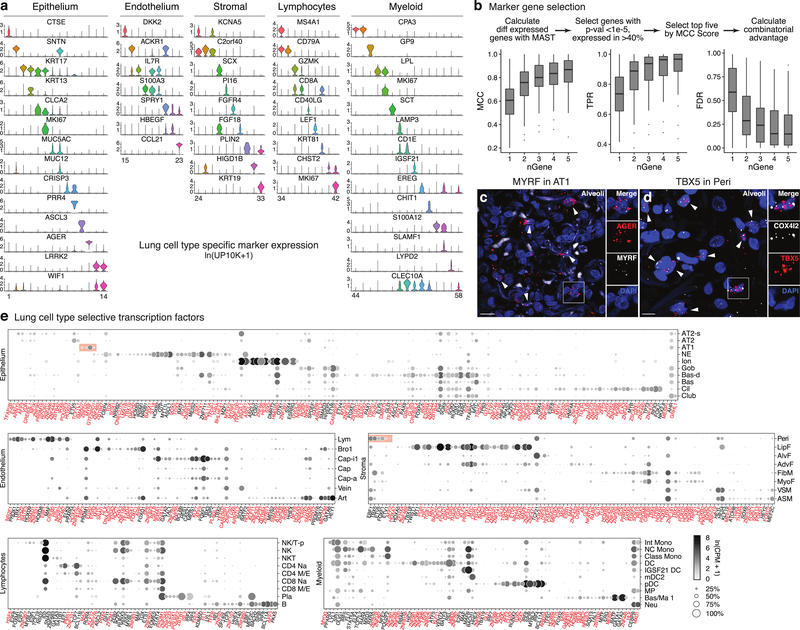
Extended Data Figure 5. Markers and transcription factors that distinguish human lung cell types.
a, Violin plots of expression levels (ln(UP10K + 1)) of the most sensitive and specific markers (gene symbols) for each human lung cell type in its tissue compartment (10x dataset). Cell numbers given in Supplementary Table 2. b, Scheme for selecting the most sensitive and specific marker genes for each cell type using Matthews Correlation Coefficient (MCC). Box-and-whisker plots below show MCCs, True Positive Rates (TPR), and False Discovery Rates (FDR) for each cell type (n=58) using indicated number (nGene) of the most sensitive and specific markers (10x dataset). Note all measures saturate at approximately 2–4 genes, hence simultaneous in situ probing of a human lung for the ~100–200 optimal markers would assign identity to nearly every cell. c, Alveolar section of human lung probed by smFISH for AT1 marker AGER and transcription factor MYRF. MYRF is selectively expressed in AT1 cells (arrowheads; 97% of MYRF+ cells were AGER+, n=250 scored cells). Inset, boxed region showing merged and split channels of AT1 cell. Bar, 10 μm. Staining repeated on 2 subjects. d, Alveolar section of human lung probed by smFISH for pericyte marker COX4I2 and transcription factor TBX5. TBX5 is enriched in pericytes (arrowheads, 92% of TBX5+ cells were COX4I2+, n=250). Inset, boxed region showing merged and split channels of pericyte. Bar, 5 μm. Staining repeated on 2 subjects. e, Dot plot of expression of enriched transcription factors in each lung cell type (SS2 dataset). Red text, genes not previously associated with the cell type. Red shading, transcription factors including MYRF that are highly enriched in AT1 cells, and TBX5 and others highly enriched in pericytes. For more details on statistics and reproducibility, please see Methods.

