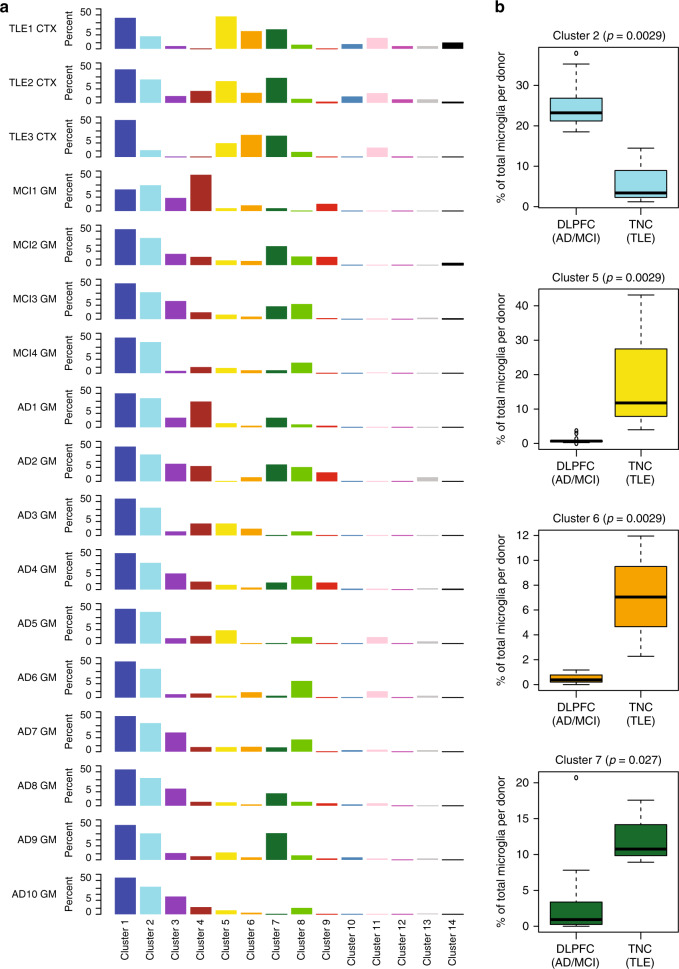
Fig. 3. Cluster distribution within donors and provenance of clusters.
a Distribution of cells among the different cell clusters for each donor. Each column represents a cluster, and each row represents a subject. The data are presented as the percentage of the cells in a given cluster within a given donor. Cluster 1 is the most abundant cluster in all subjects. Each cluster is color coded according to Fig. 2. b Clusters with differential proportions in the DLPFC (AD & MCI) autopsy samples versus the TNC (TLE) surgical tissue samples. Boxplots of the distribution of proportions of the 4 clusters with statistically significant differences between the two sample groups. The DLPFC (AD & MCI) group contains 14,142 cells from 14 donors (MCI1 GM - MCI4 GM, AD1 GM- AD10 GM), while the TNC (TLE) group contains 2103 cells from 3 donors (TLE1 CTX – TLE3 CTX). Significance was assessed using the (non-parametric) Mann–Whitney test, resulting in the p-values shown for each cluster. All tests were two-sided. The boxes represent the 25th percentile, median, and 75th percentile. The whiskers extend to the furthest value that is no more than 1.5 times the inter-quartile range (default parameter for R’s boxplot function). Source data for this figure are provided in the Source Data file. DLPFC dorsolateral prefrontal cortex, TNC temporal neocortex, MCI mild cognitive impairment, AD Alzheimer’s disease, TLE temporal lobe epilepsy, GM gray matter, CTX cortex.

