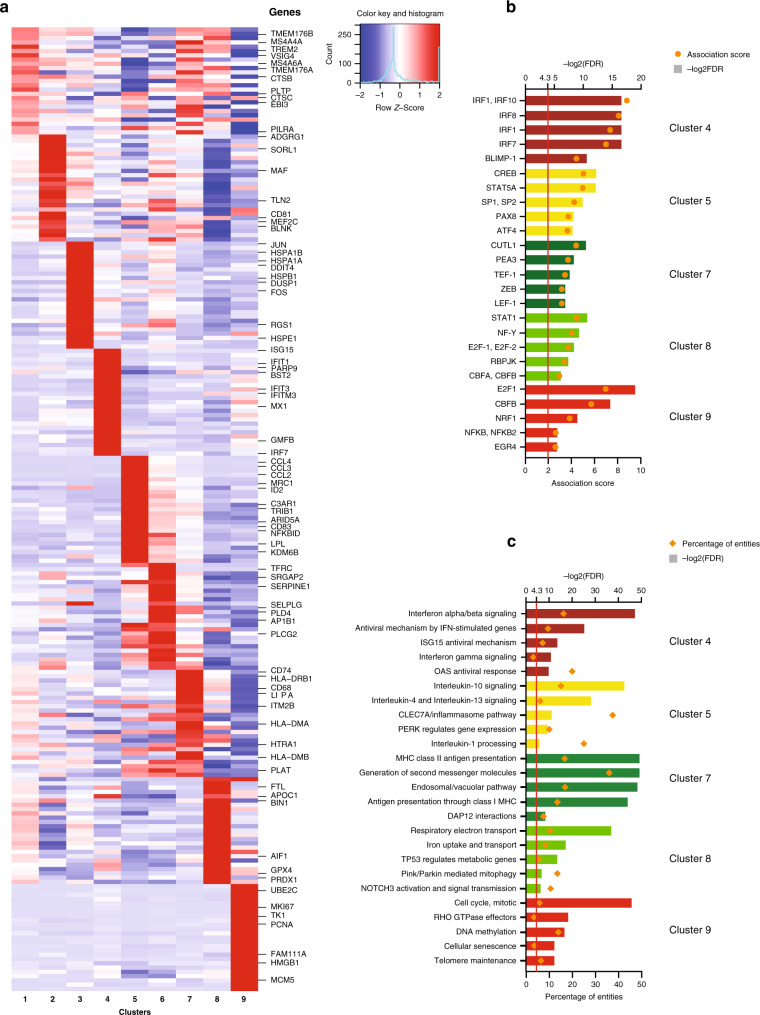
Fig. 5. Functional annotation of the microglial clusters.
a Heatmap depicting the z-scores of the top differentially expressed signature genes (using the edgeR software package, adjusted p-value < 0.05, with Benjamini–Hochberg FDR correction, ordered by adjusted p-value) of each microglial cluster, with representative genes highlighted on the right side of the figure. Rows represent genes, and each cluster is presented in a column. The color coding represents the mean expression (transcripts per million) in the cluster, Z-scored over all the clusters, as shown in the color key with histogram. The z-score matrix is available in Supplementary Data 16. b Predicted transcription factors whose binding sites are enriched among the differentially expressed genes of each microglial cluster. In rows, the names of the transcription factors are shown. Enrichment p values were calculated with PASTAA. The columns are colored according to the cluster identity introduced in Fig. 2. c Functional annotation of certain microglia clusters using REACTOME pathways significantly enriched for their signature genes (top 50 differentially expressed genes). The bar graphs are color coded according to cluster identity as introduced in Fig. 2. FDR false discovery rate.

