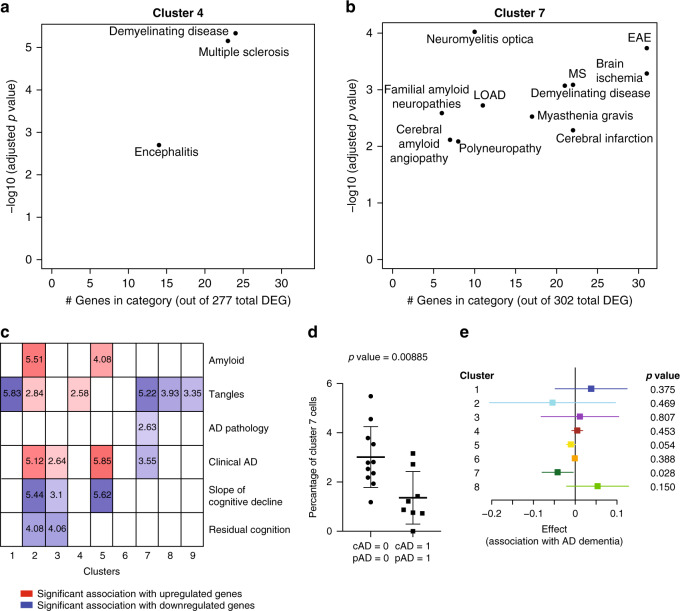
Fig. 8. Disease association in human microglia clusters.
a, b Scatter plots depicting brain related diseases – using gene sets from the disease ontology database (http://disease-ontology.org/) – that are significantly enriched (adjusted p-value < 0.01, hypergeometric test with Benjamini–Hochberg correction) in a given microglial cluster, using the cluster-defining signature gene sets of each microglia subset. Results for two different clusters are shown (cluster 4 and cluster 7); results for the other microglial clusters are included in Supplementary Fig. 10. In each plot, the y-axis reports the p-value of the enrichment analysis while the x-axis reports the number of genes that overlap between the cluster and disease gene sets, an indication of the robustness of the enrichment. c Panel reporting the result of enrichment analyses between the genes defining the microglial clusters and those genes that are associated with certain pathological or clinical traits found in the aging human brain (bulk DLPFC RNA sequencing data) in the ROS and MAP cohorts. Log10 adjusted p-values (using the hypergeometric test with Benjamini–Hochberg correction) are shown for those cluster/trait combinations where they are significant, and the saturation of each box is related to the strength of the association; red shades indicate overlap between cluster-defining genes and genes upregulated with the trait, whereas blue shades indicate overlap between cluster-defining genes and genes downregulated with the trait. d Dot plot comparing the frequency of IBA1+CD74high cells within the IBA1+cells in DLPFC tissue sections from New York Brain Bank subjects with both AD dementia and a pathological diagnosis of AD (cAD = 1, pAD = 1; n = 8) to that found in subjects who fulfill neither of these diagnostic criteria (cAD = 0, pAD = 0; n = 11). Every dot is an individual donor (see Supplementary Data 9). Overlaid on the dot plot, data are also presented as mean values ± SD. The statistical test used was an unpaired t test with a two tailed p value. There is no difference in the frequency of IBA1+ cells (Supplementary Fig. 14a). See Supplementary Data 9 for demographics of the donors and Source Data file for raw data. e Forest plot presenting the effect size of the association statistic from an analysis comparing the frequency of a given microglial cluster in subjects with a diagnosis of AD dementia and a pathologic diagnosis of AD (cAD = 1, pAD = 1; n = 18) versus subjects that do not meet these diagnostic criteria (cAD = 0, pAD = 0; n = 20). The primary analysis involves cluster 7 to replicate results shown in panel d, and we also present results for the eight other microglial clusters that we have defined in this manuscript. The per individual proportions of each cluster is shown in Supplementary Fig. 14b. The mean of the coefficient (effect size) presented here is derived from a standard linear regression model (dependent variable = proportion of each microglial type over the total microglial nuclei for a donor, independent variable = AD pathology/dementia diagnosis, either 0 or 1, as in Fig. 8d). Bars in the forest plot represent the 95% confidence interval for the coefficient, and the p-value represents a two-sided t-test on whether the coefficient is significantly different from 0. P-values were Bonferroni corrected for multiple comparisons. Source data are provided as a Source Data file. DEG differentially expressed genes, AD Alzheimer’s disease, LOAD late onset Alzheimer’s disease, MS multiple sclerosis, EAE experimental autoimmune encephalomyelitis, cAD clinical diagnosis of AD dementia, pAD pathological diagnosis of AD.

