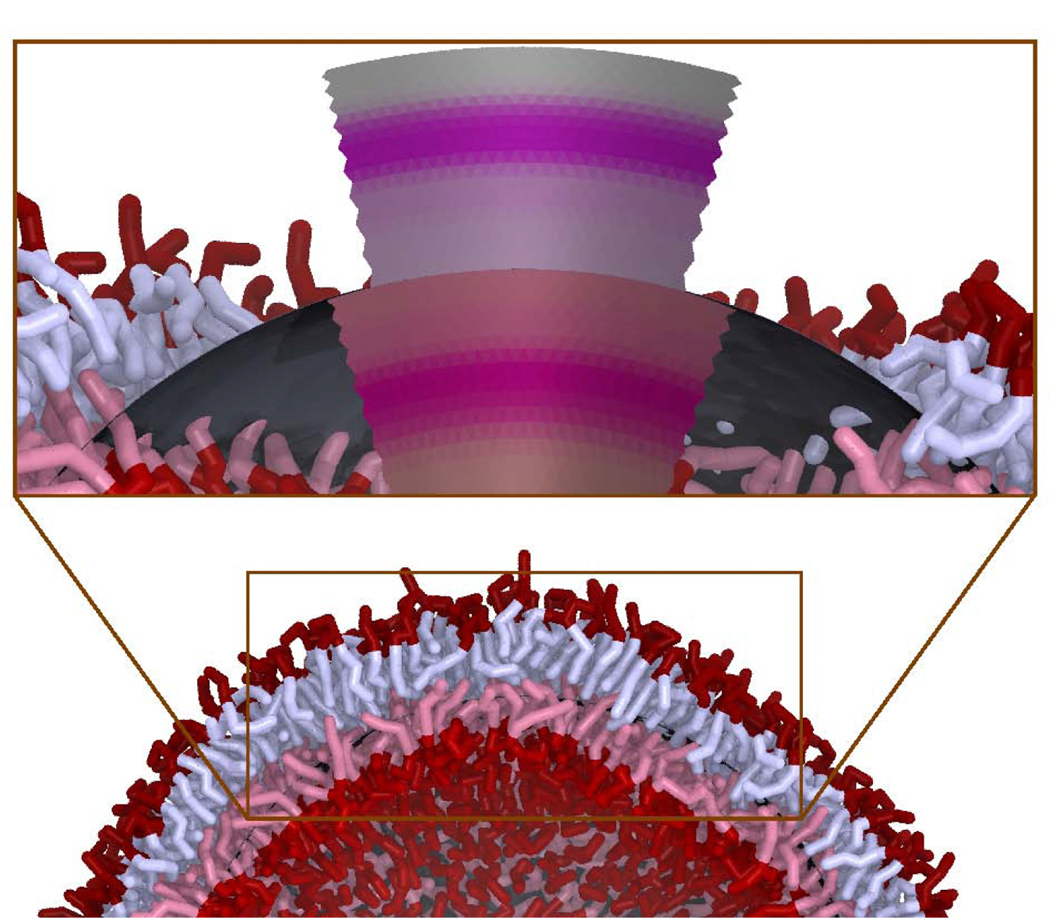
Figure 3:
An illustration of how a surface continuum model, combined with a scattering length density profile from molecular simulation, βLA(z), is used to model the scattering centers from a dynamically fluctuating vesicle of a particular size. A frame of a simulation of a Martini vesicle is shown (water is removed from the image for clarity). In the inset, a portion of the lipids are removed and the continuum model is shown. The underlying approximately spherical continuum model is shown in dark grey while the deformed NSLD is shown for both the outer and inner leaflets. The shapes of the inner and outer leaflets are discontinuous because, in this model, the leaflets deform semi-independently (they meet at the dark grey continuum-modeled midplane). The inner leaflets of the Martini model and continuum-modeled density are both tinted red.

