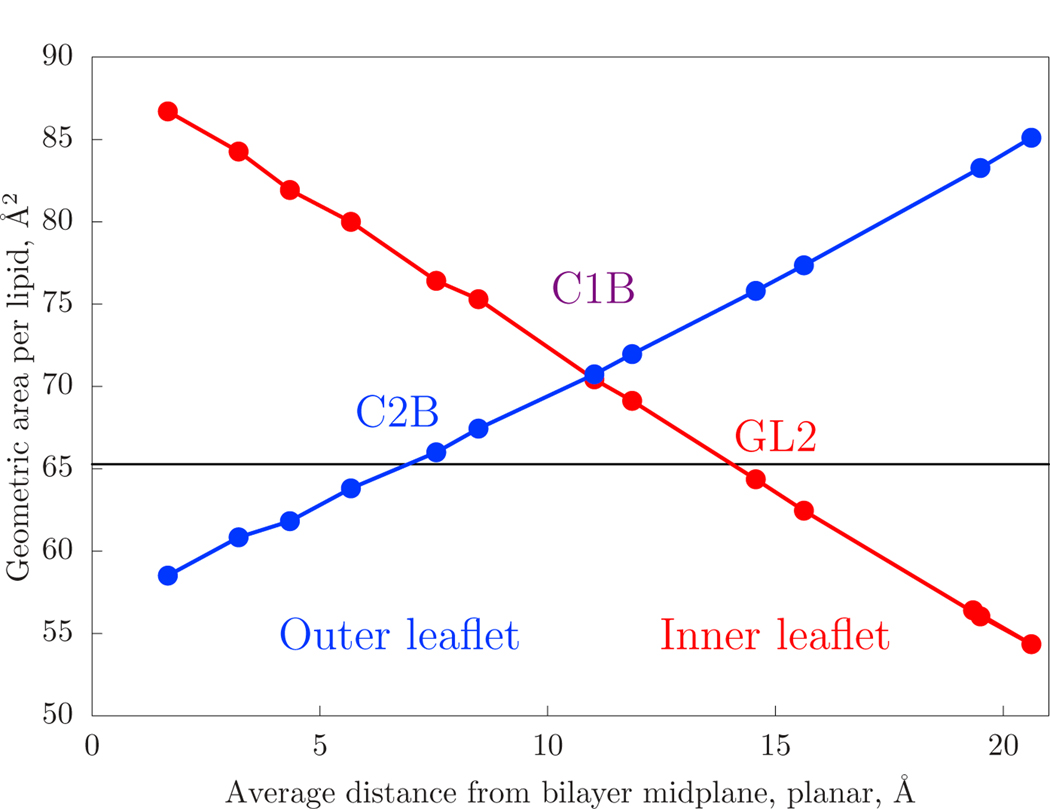
Figure 4:
The geometric area-per-lipid (4πR2 divided by the number of lipids) of a Martini site in a ca. 18 nm diameter vesicle plotted against the same site’s height above the bilayer midplane in a planar simulation. The form is expected to be linear, as per Eq. 2. The area-per-lipid for the planar system, plotted as a horizontal line, is the projected area of the bilayer. The inner leaflet curve (red) plots both the NH3 sites of POPE as well as the NC3 sites of POPC. The outer leaflet curve (blue) has only POPC.

