
Figure 6.
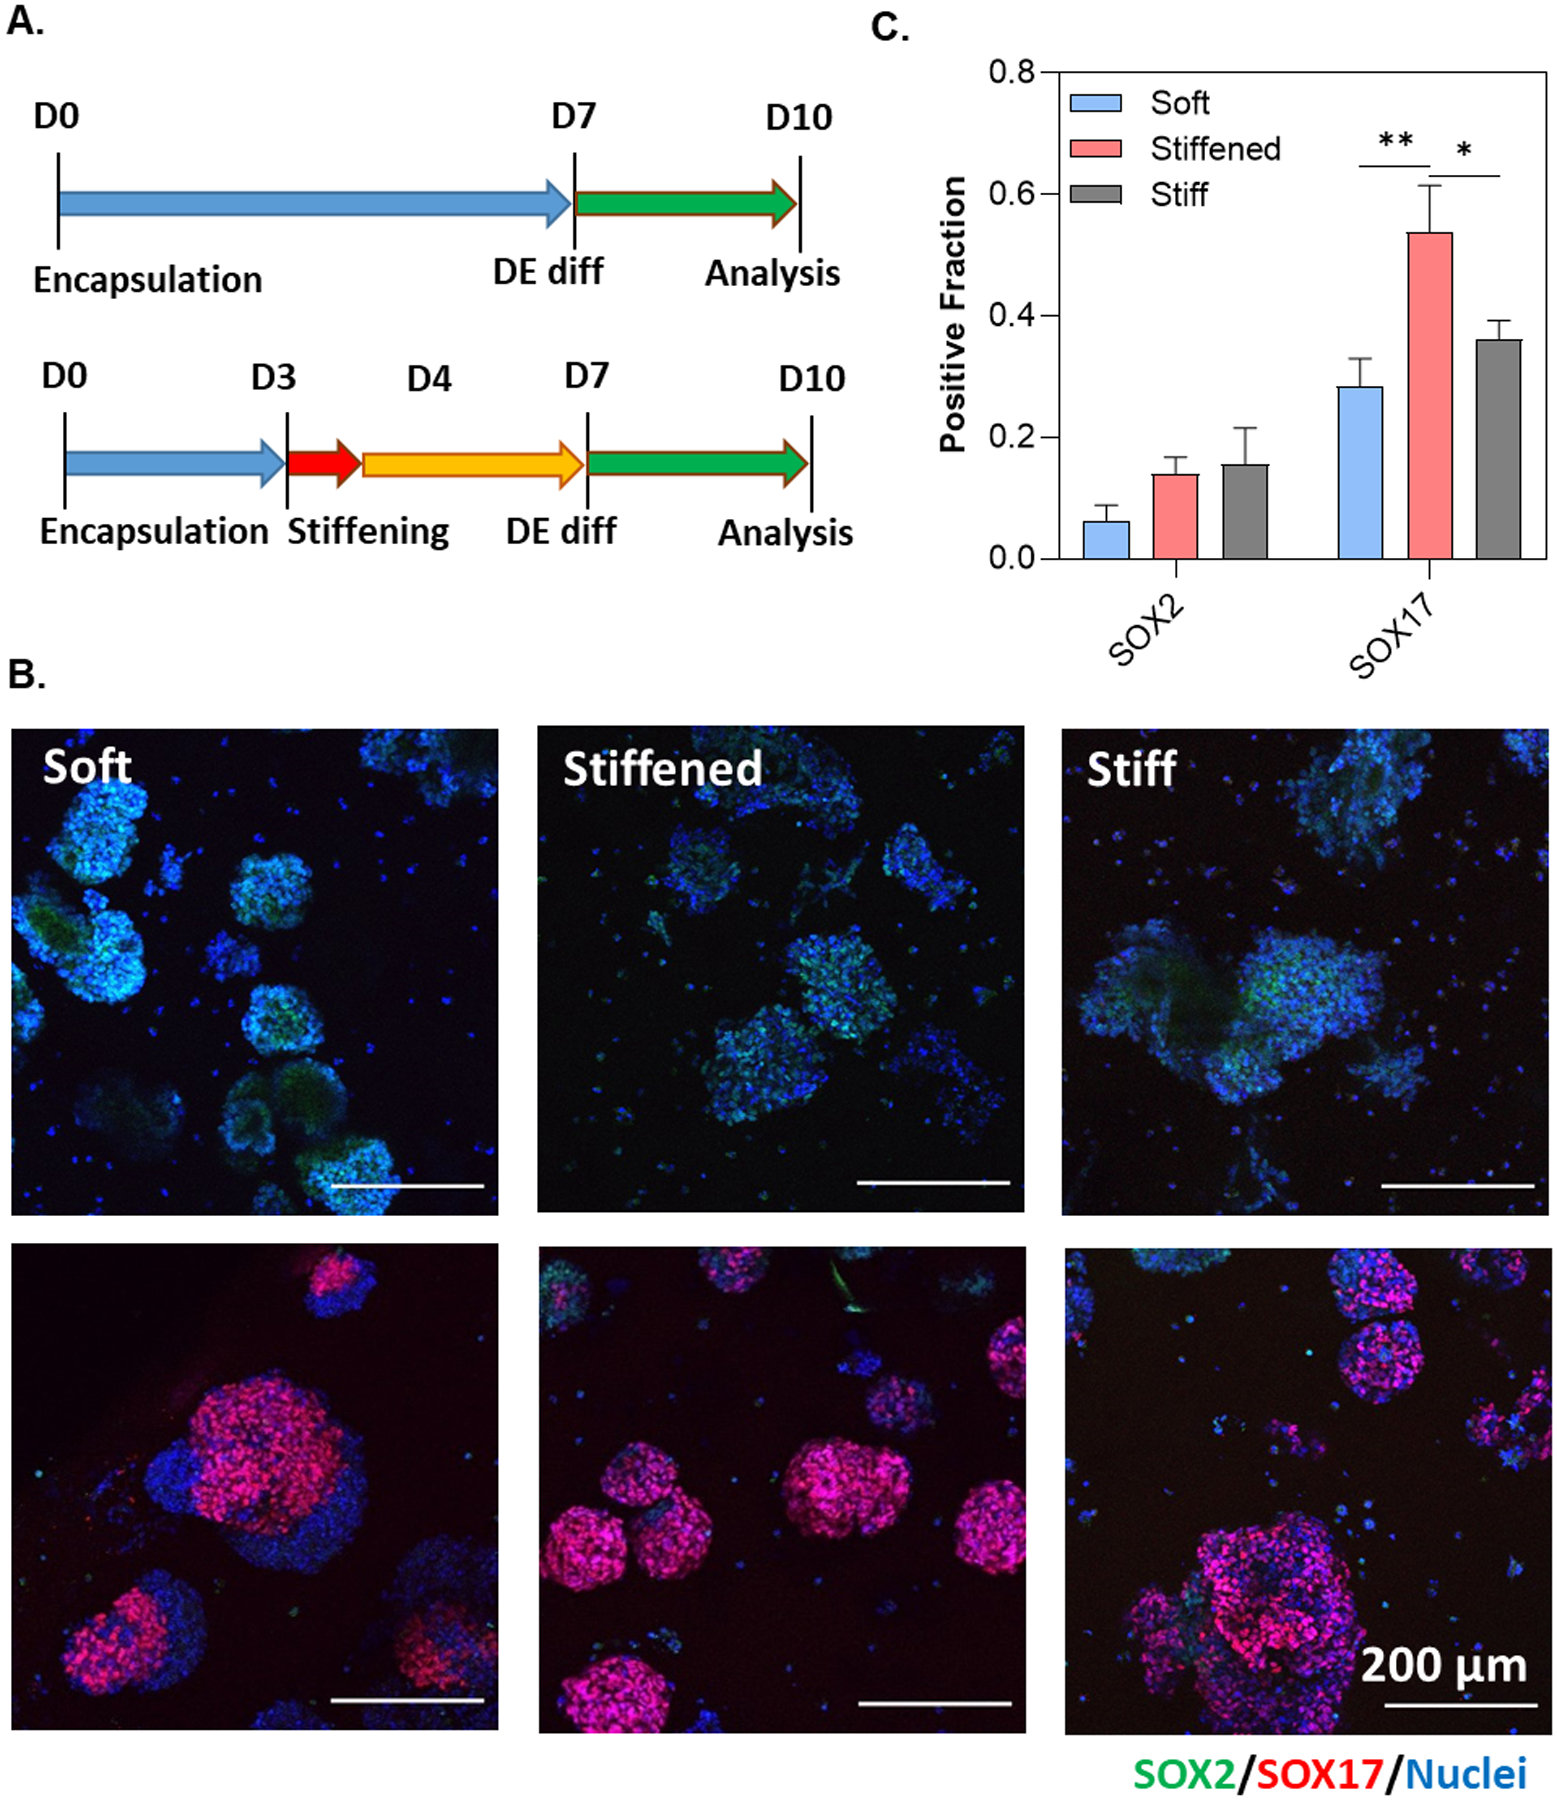
(A) Timeline of DE differentiation experiments. PEG-Tz (0.2 wt%) was added to the media for 24 hours on D3–D4. (B) Immunofluorescence staining and imaging of SOX2-iPSCs pre- and post-DE differentiation. (C) Semi-quantitation of SOX2-iPSCs post-DE differentiation. Positive fraction of either SOX2 or SOX17 was determined using ImageJ software. Statistical analysis was conducted using an ordinary one-way ANOVA (N = 9 images). **** and ** represents p < 0.0001 and p < 0.001, respectively.