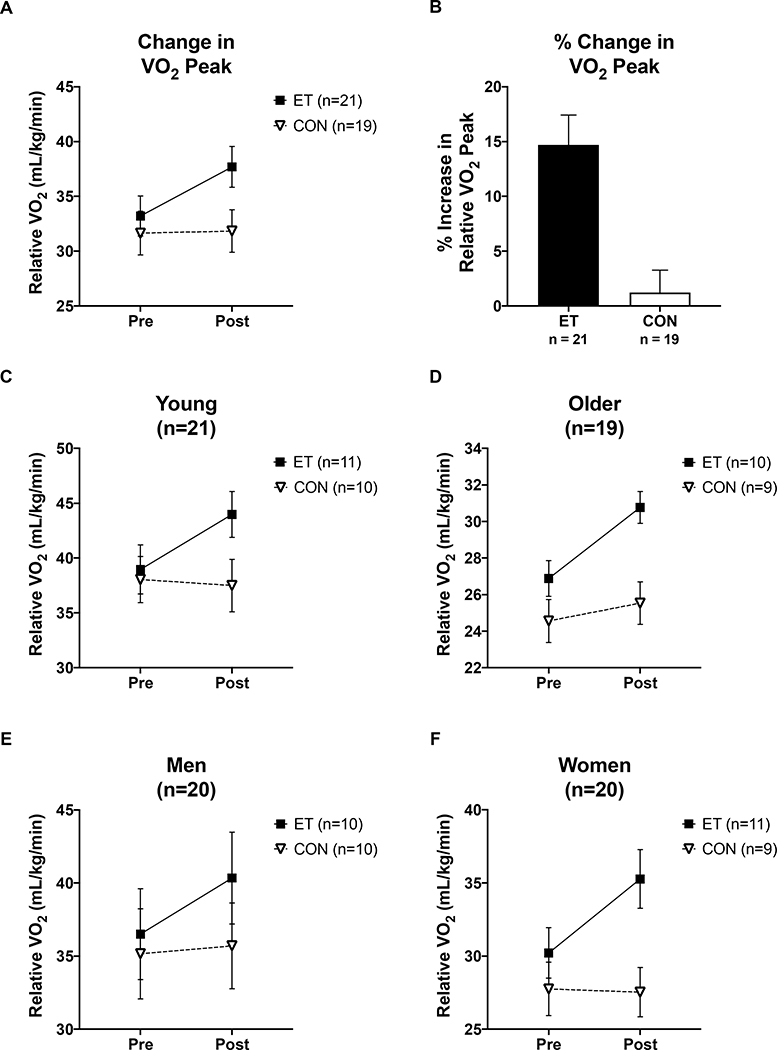
Figure 2. VO2 peak changes in response to the intervention.
(A&B) Relative VO2 peak (ml/kg/min) improved in trained subjects but not control subjects, regardless of age or sex (Intervention x Training group interaction p = 0.013). (C-F) Changes in VO2 peak by age and sex. Within the exercise trained group, there were no differences in the degree of fitness improvement by age or sex indicating the exercise training intervention had the same effect across age and sex (Compare all ET group changes in panels C-F). (Δ indicates the difference between Pre and Post Intervention for a given measurement). Black squares indicate ET group, open triangles indicate CON group. Data shown as Mean ± SEM.

