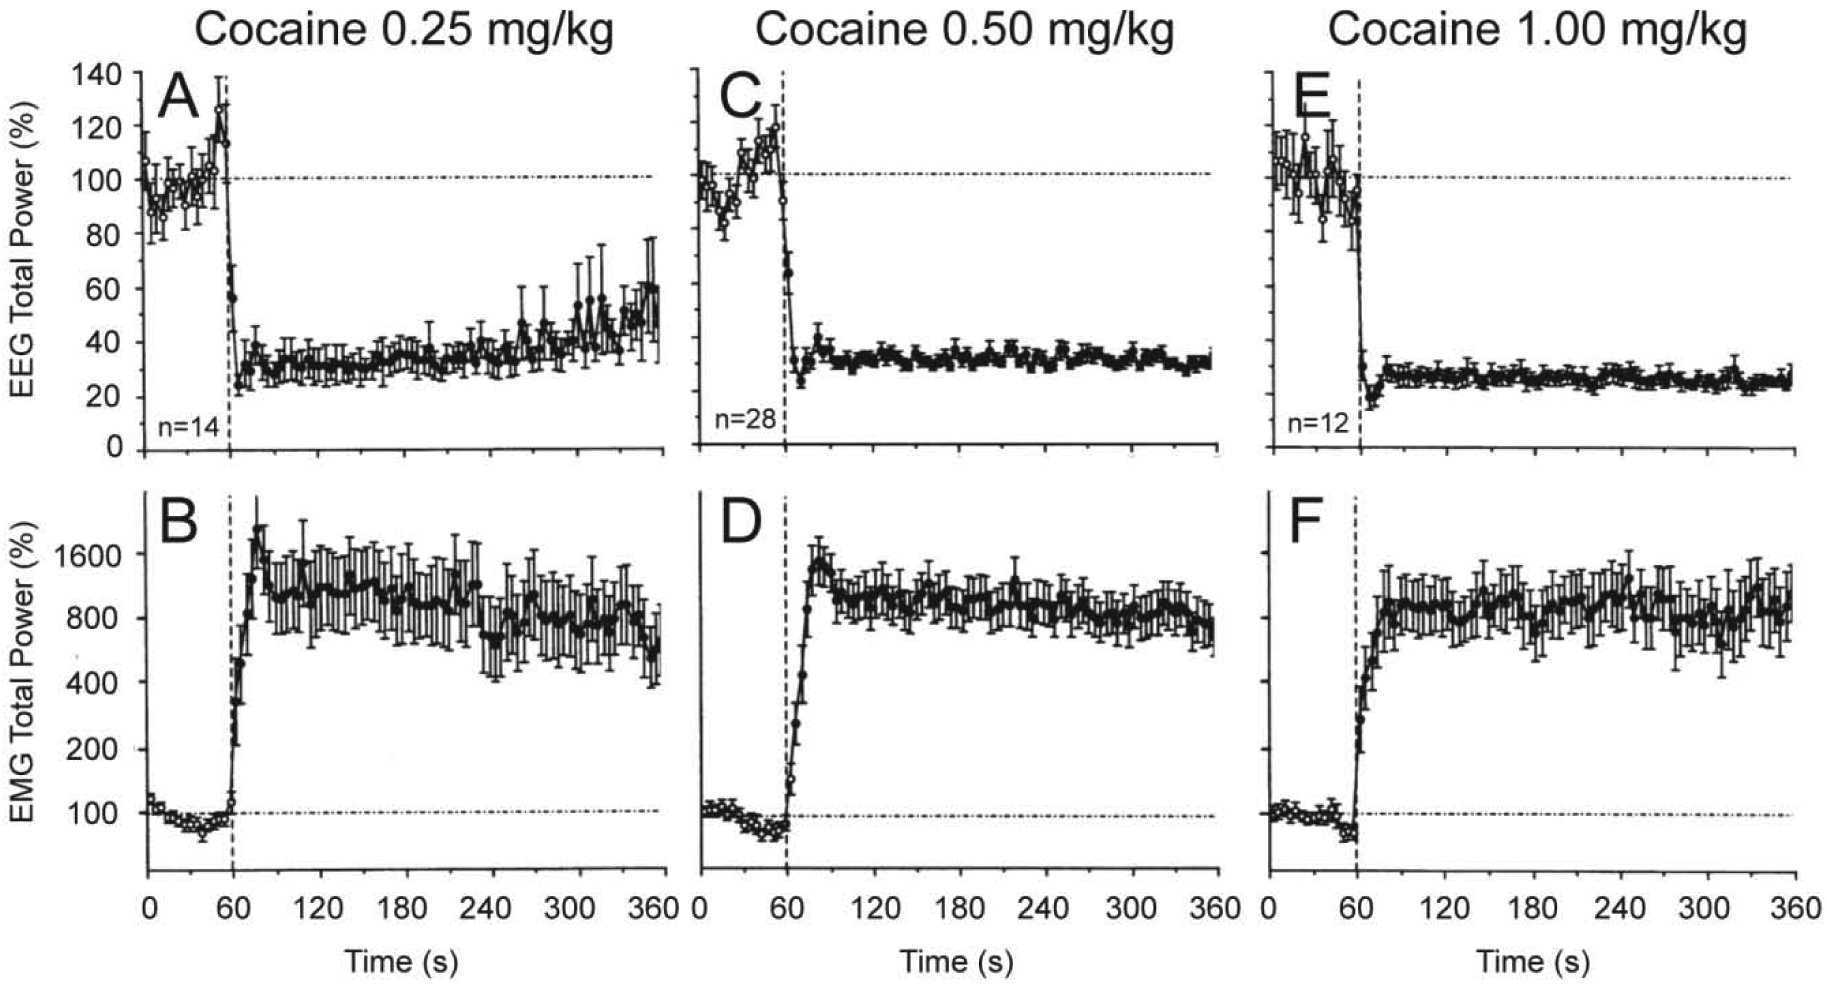
Figure 1. Phasic and tonic changes in cortical EEG (top) and neck EMG (bottom) total powers induced by iv cocaine administration at different doses within the self-administration range.

Mean (±SEM) values (for 4-s bins) are shown in percent vs. the pre-injection baseline. Vertical hatched lines (at 60 s) show the start of injections and horizontal hatched lines show basal values (100%). Filled symbols show values significantly different (Fisher F-test, p<0.05) from baseline. n=number of averaged tests. Original data were reported in Kiyatkin and Smirnov, 2010 (free PMC article).
