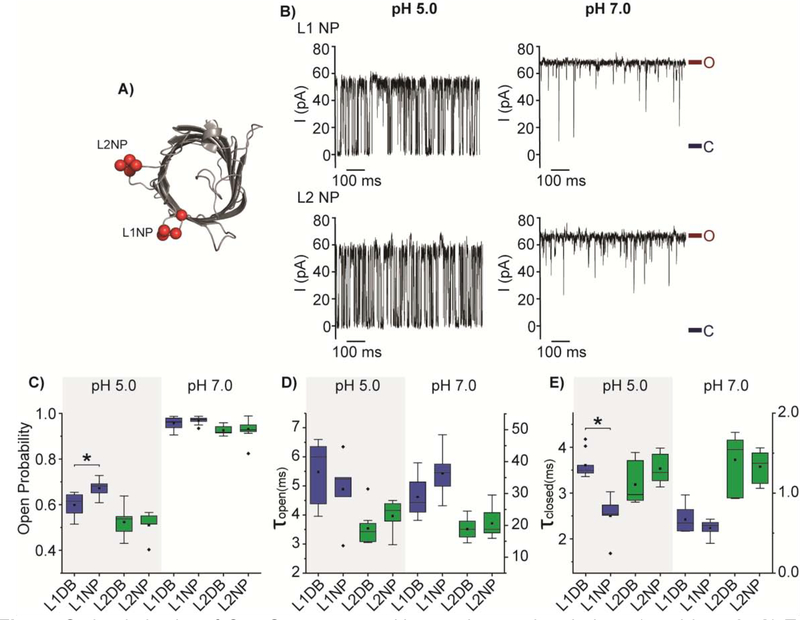
Fig. 4.
Gating behavior of OmpG constructs with negative patches in loop 1 and loop 2. A) Top view of the cartoon representation of OmpG (PDB:2IWW). Red balls represent the mutated residues at the loops. B) Representative single channel recording traces of L1 NP and L2 NP. The open and closed states were marked with maroon and navy lines, respectively. Box plots of C) the open probability, D) the inter-event duration (τopen) and E) the event duration (τclosed) of OmpG constructs. Buffers used were 1M KCl in 20 mM sodium acetate pH 5.0 or 20 mM Tris HCl pH 7.0. The applied potential was +50 mV. All data were derived from at least five independent recordings. Two-tailed student’s t-tests were performed to compare DB constructs and NP constructs of each loop with stars (*) marking the results with p-values < 0.05. L1 mutations are represented in blue and L2 mutations in green. Detailed statistics were shown in Table S3.

