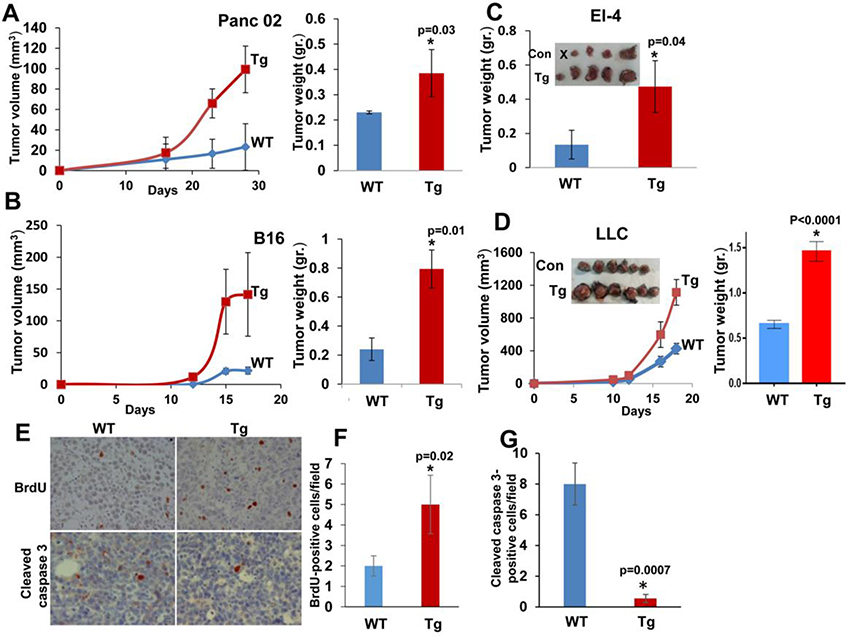
Figure 2. Tumor growth prevails in Hpa-tg mice.
A-D. Tumor growth. The indicated cell line was inoculated subcutaneously (s.c) in WT (Con) and Hpa-tg mice and tumor growth was inspected over time (A, B, D, left panels). At termination, tumors were excised, weighed (A-D right panels) and fixed in formalin for histological evaluation. E-G. Immunostaining. Tumor xenografts produced by El-4 mouse lymphoma cells were subjected to immunostaining applying anti-BrdU (E, upper panels) and anti-cleaved caspase-3 (E, lower panels) antibodies. Quantification of the staining is shown graphically in F and G, respectively. Original magnification: x40.

