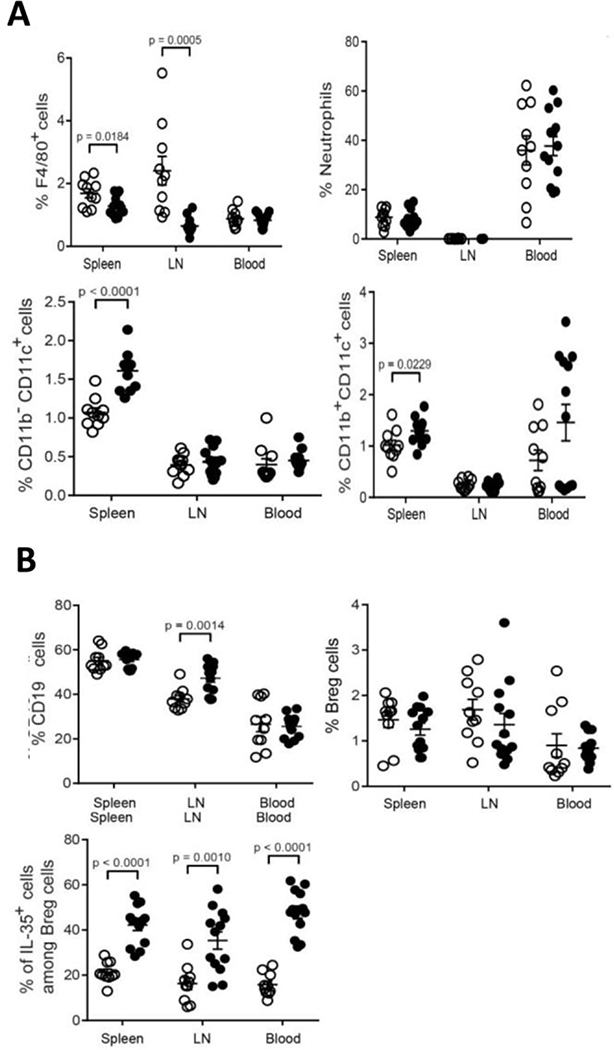
Figure 7.
Percentage of immune cell populations in the spleen, inguinal lymph nodes and blood of LLC tumor bearing WT (open dots) vs. Hpa-tg (closed dots) mice. A. Percent macrophages (top, left panel), neutrophils (Ly6G) (top, right panel), CD11b−CD11c+ dendritic cells (bottom, left panel), and CD11b+CD11c+ dendritic cells (bottom, right panel). Note, decreased percentage of macrophages and increased percentage of dendritic cells in Hpa-tg (closed dots) vs. WT (open dots) mice. B. Percent CD19+ (top, left panel), CD19+CD5+CD1d+ Breg cells (top, right panel), and IL-35+ cells among Breg cells (bottom, left panel). Note increased levels of IL-35+ Breg cells in Hpa-tg mice. Unpaired t-tests were performed for comparison between WT and Hpa-tg mice for the different innate cell types. The actual percentage of immune cells ± SEM is presented in Supp. Table 1.

