
Fig. 2.
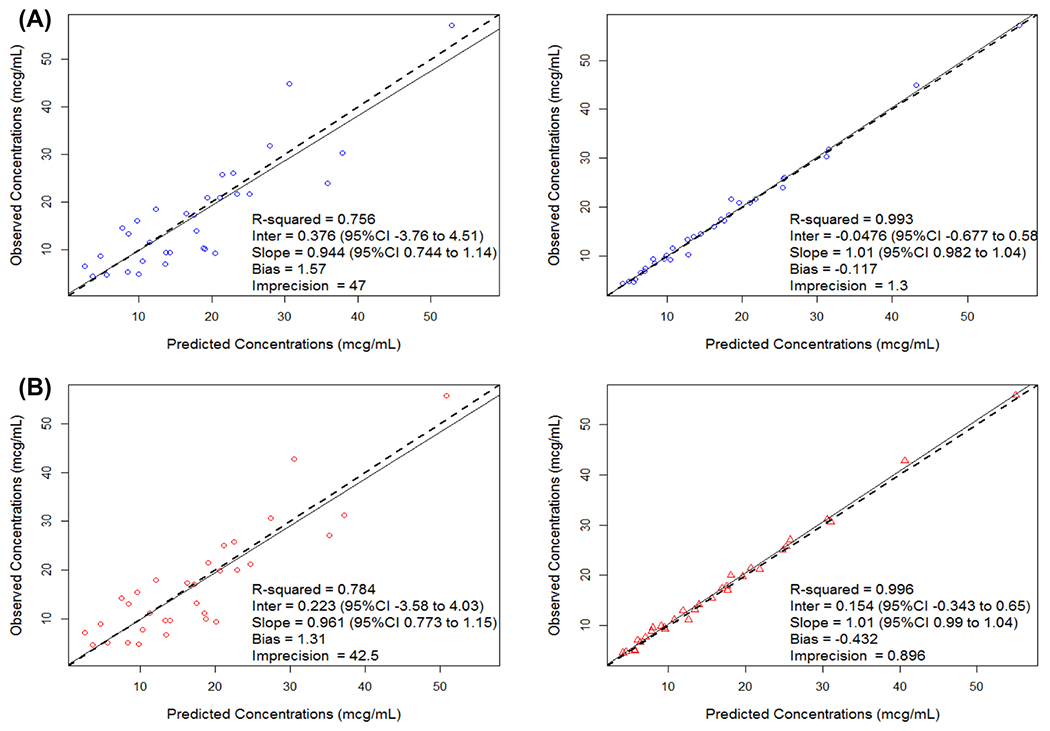
Goodness-of-fit plot for population (left figure) and Bayesian (right figure) predicted to observed vancomycin concentrations (mcg/ml) for Pre (a) and Post (b) oxygenation
Official websites use .gov
A
.gov website belongs to an official
government organization in the United States.
Secure .gov websites use HTTPS
A lock (
) or https:// means you've safely
connected to the .gov website. Share sensitive
information only on official, secure websites.
Goodness-of-fit plot for population (left figure) and Bayesian (right figure) predicted to observed vancomycin concentrations (mcg/ml) for Pre (a) and Post (b) oxygenation