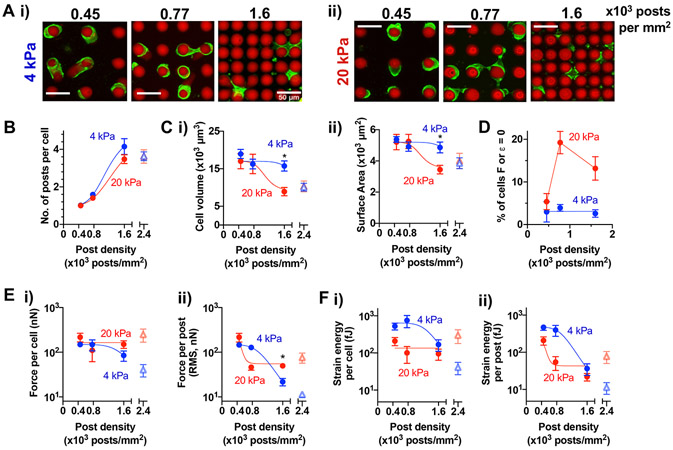
Figure 2. Micropost density and elastic modulus impact MSC volume, traction force, and strain energy.
(A) Representative images of live MSCs (green: plasma membrane stain) after 24h of culture on (i) 4-kPa and (ii) 20-kPa post arrays (red). Scale bar = 50 μm. (B) The number of interacting microposts per cell. (C) Quantification of cell (i) volume (ii) surface area. (D) Percent of cells that bend posts with traction force or strain energy (see Methods) above zero. (E) Traction force (i) per cell (ii) per post. (F) Strain energy (i) per cell, (ii) per post. All data points were plotted as a function of post density in 4-kPa or 20-kPa arrays. The data points showing monotonic changes as a function of post density were fitted to a dose-response curve, . Values for each graph in terms of (min, max, potency, b): (B) 4 kPa = (1, 5, 1175, 4.3), 20 kPa = (1, 5, 1404, 3.8); (C, i) 4 kPa = (9000, 17000, 1931, −8.9), 20 kPa = (9000, 17000, 1100, −7.1); (C, ii) 4 kPa = (3500, 5200, 1931, −8.6), 20 kPa = (3500, 5200, 1100 −7.0); (E, i) 4 kPa = (48, 147, 1464, −7.2); (E, ii) 4 kPa = (10, 148, 1057, −5.7), 20 kPa = (55, 213, 504, −10.5); (F, i) 4 kPa = (50, 639, 1385, −7.3); (F, ii) 4 kPa = (12, 476, 1007, −6.1), 20 kPa = (43, 208, 502, −10.0). *p < 0.05, two-way repeated measures ANOVA followed by Tukey’s multiple comparisons testing. All error bars represent the SEM values across 3 different MSC donors; n ≥ 70 cells per donor. Open triangle symbols at post density 2.4 x 10³ posts/mm2 represent mean values from arrays with triangular post arrangement from n ≥ 85 cells (Fig. S3).

