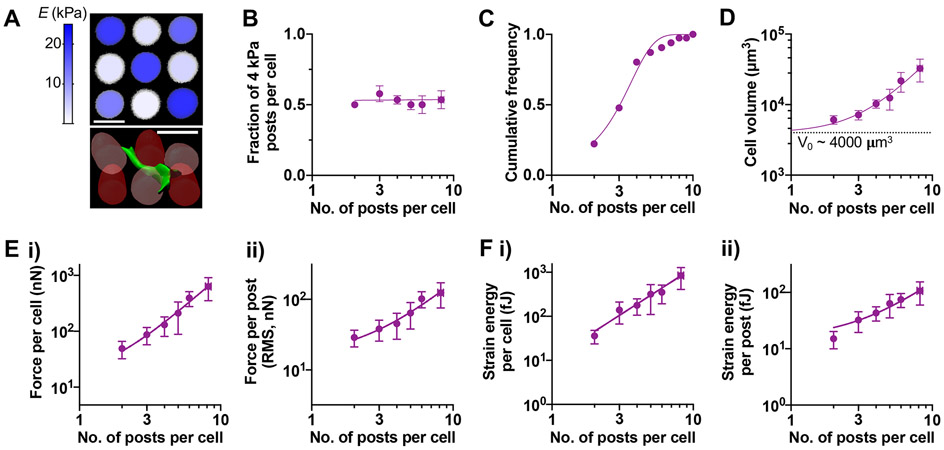
Figure 4. Scaling of cell volume, traction force, and strain energy with the number of interacting microposts in mechanically heterogeneous arrays.
(A) Representative images. (Top) Confocal stack maximum intensity projection of representative mixed post arrays, colorized according to elastic modulus as measured by AFM. Scale bar = 25 μm. (Bottom) 3D reconstruction of a live MSC in mixed post arrays. Dark red: 20-kPa post, light red: 4-kPa post, green: human MSC labeled with plasma membrane stain. (B) Fraction of 4-kPa posts contacted by each cell as a function of the number of interacting posts per cell (npost). The data were fitted to Y = 0.52. (C) Cumulative frequency distribution of npost in mixed arrays. Mean ± SD = 3.04 ± 1.48. (D) Scaling of cell volume with npost. (E) Scaling of traction force (i) per cell, (ii) per post with npost. (F) Scaling of strain energy (i) per cell, (ii) per post with npost. For (D)-(F), all data points were fitted to a power law equation, Y = A0 + A.npostα. Values for each graph in terms of (A0, A, α): (D) = (4000, 328.7, 2.1); (E, i) = (0, 8.5, 2.1); (E, ii) = (0, 9.5, 1.3); (F, i) = (0, 10.9, 2.1); (F, ii) = (0, 7.7, 1.3). All error bars represent 95% confidence intervals. n = 117 cells pooled from 2 donors, grouped based on npost.

