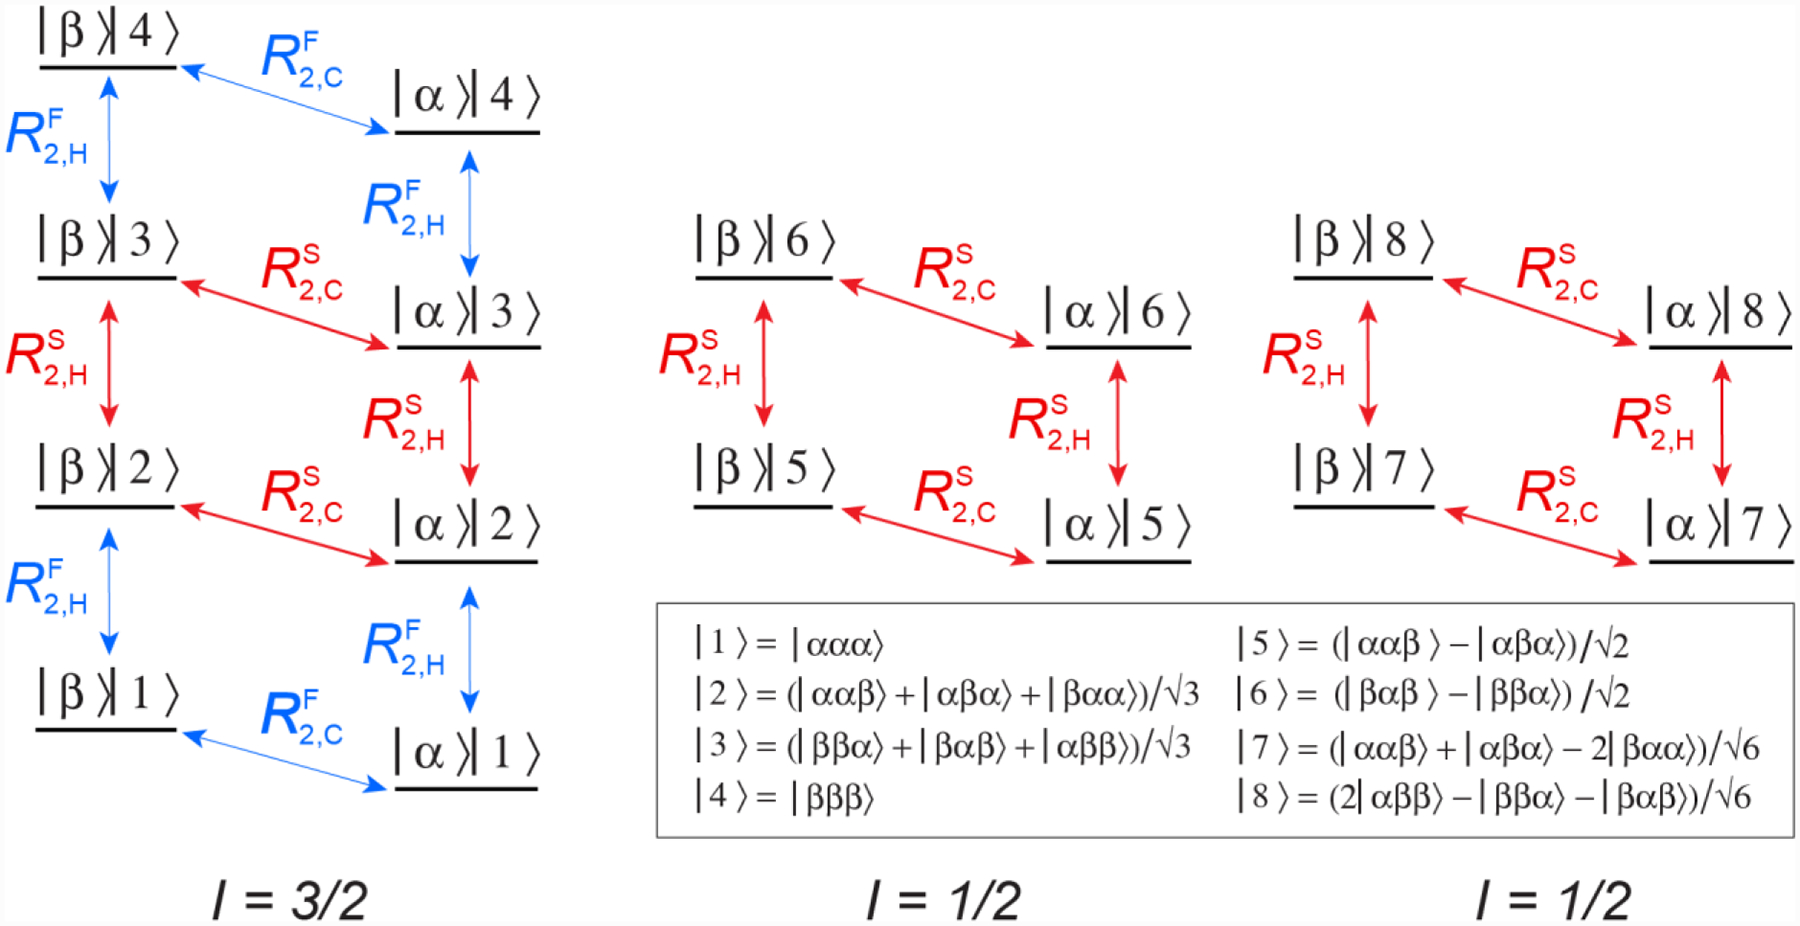
Figure 1.

Energy level diagram of the 13CH3 (AX3) spin-system of a methyl group. Single-quantum 1H and 13C transitions are shown by vertical and diagonal arrows, respectively. The slow- and fast-relaxing 1H (R2,H) and 13C (R2,C) transitions are distinguished by superscripts ‘S’ and ‘F’ and shown with red and blue arrows, respectively. The spin quantum numbers, I, of the three manifolds are specified below the energy level diagram. The 16 eigenstates are represented by |m>|n>, where |m> is the state of the 13C spin, m ∈ {α,β}, and the 8 1H eigen-states |n> are described by linear combinations of |i,j,k> (i,j,k ∈ {α,β}). Theoretical expressions for the transverse spin relaxation rates R2,H and R2,C in the macromolecular limit can be found, for example, in (Tugarinov and Kay 2013).
