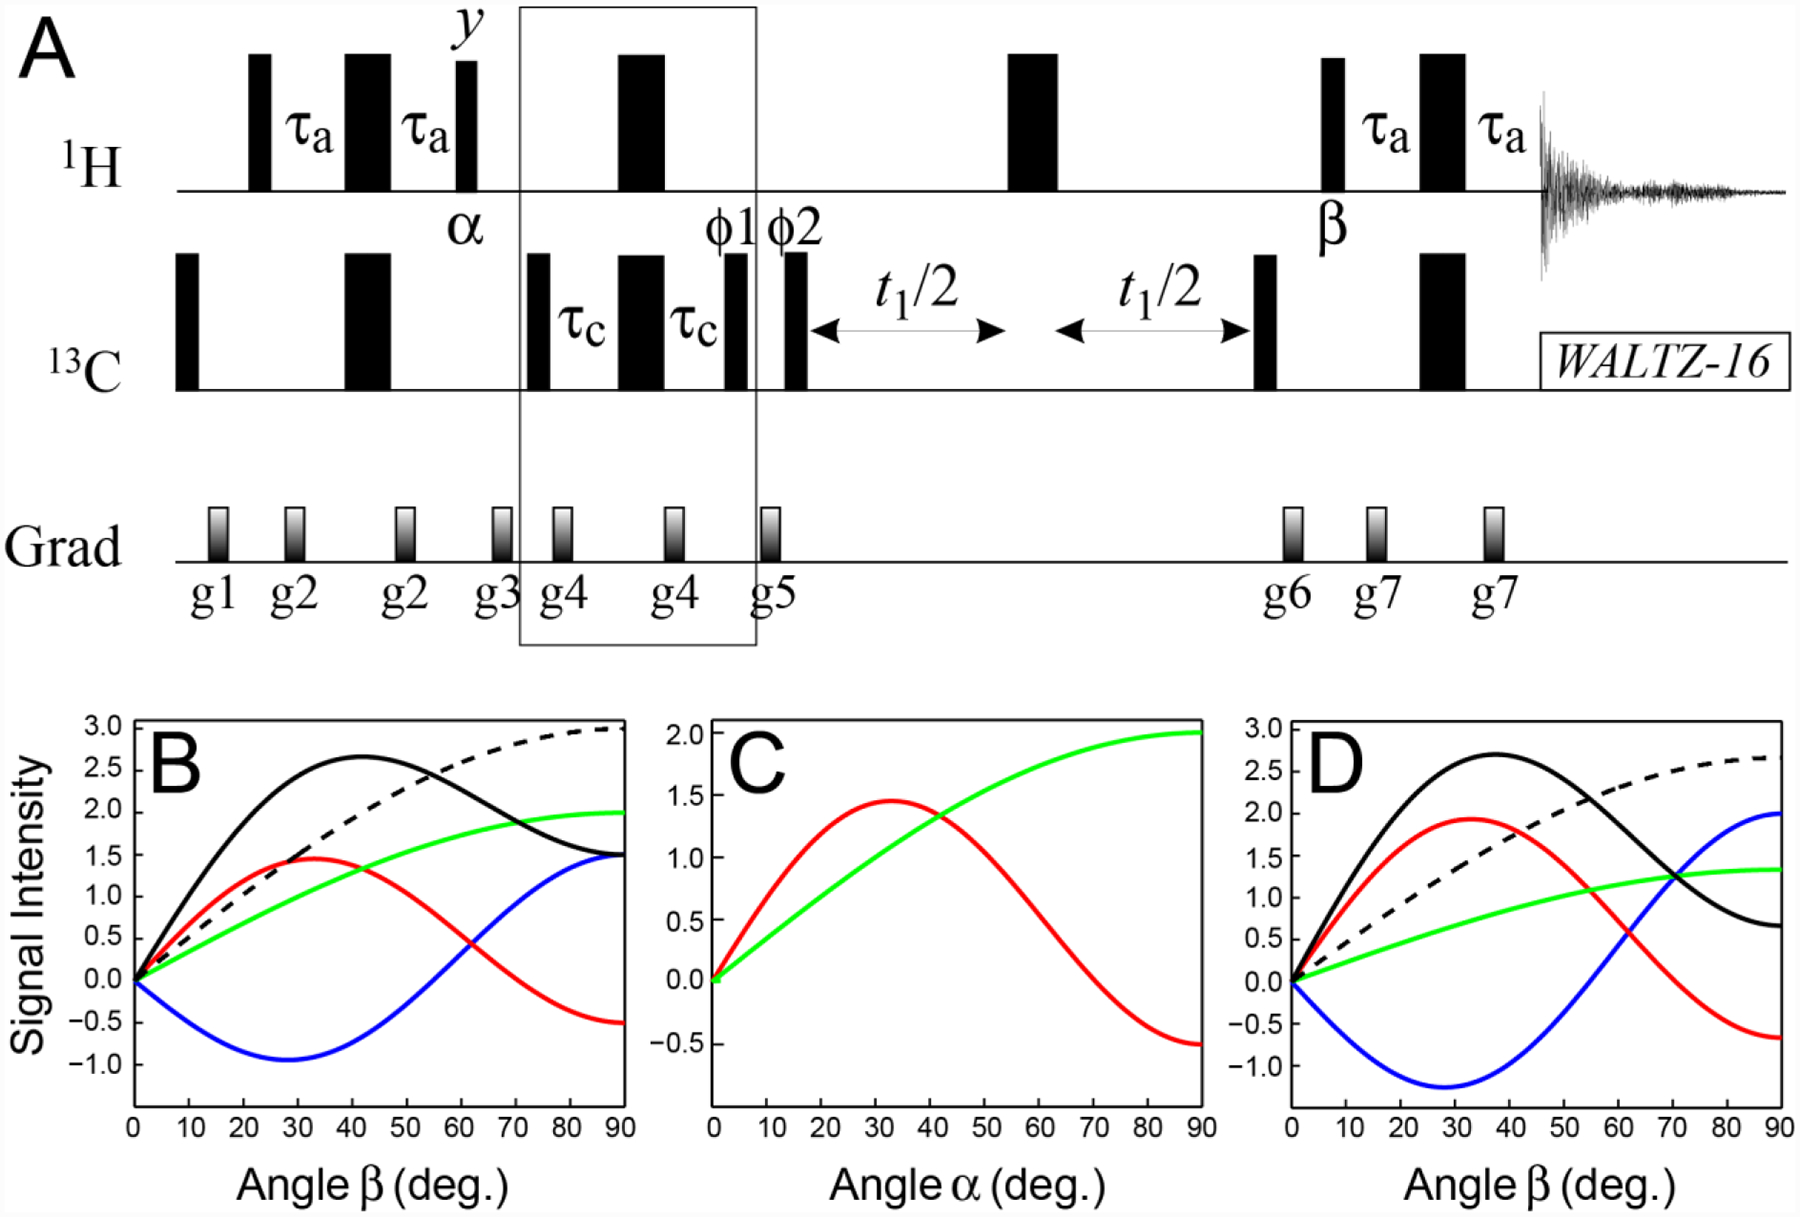
Figure 2.

(A) Pulse-scheme for selection of the slow-relaxing 13C transitions in methyl groups (SHSQC). All narrow and wide rectangular pulses are applied with flip angles of 90° and 180°, respectively, along the x-axis unless indicated otherwise. The 1H and 13C carrier frequencies are positioned in the center of the Ileδ1-Leu-Val methyl region (0.5 and 20 ppm, respectively). All 1H and 13C pulses are applied with the highest possible power, while 13C WALTZ-16 decoupling (Shaka et al. 1983) is achieved using a 2-kHz field. Delays are: τa = 1/(4JHC) = 2.0 ms, τc = 1/(12JHC) = 0.67 ms. The durations and strengths of pulsed-field gradients in units of (ms; G/cm) are: g1 = (1; 25), g2 = (0.5; 15), g3 = (1.5; 15), g4 = (0.4; 20), g5 = (1.0; 20), g6 = (0.8; −20), g7 = (0.5; 12). The phase cycle is: ϕ1 = 2(x),2(−x); ϕ2 = x,−x; receiver phase = (x,−x,−x,x). Quadrature detection in t1 is achieved via States-TPPI (Marion et al. 1989) incrementation of ϕ2. (B–D) Signal intensities (arbitrary units) of the fast-relaxing SQ 1H/13C transitions (blue curves), and the slow-relaxing SQ 1H/13C transitions of the I = 3/2 (red curves) and I = 1/2 (green curves) manifolds calculated for (B) the first direct acquisition point (t2 = 0) of the SHSQC experiment shown in panel A as a function of the angle β (deg.); (C) the first point in the indirect (13C) dimension (t1 = 0) as a function of the angle α (deg.) following selection of the slow-relaxing 1H transitions; (D) the first direct acquisition point (t2 = 0) as a function of the angle β after selection of the slow-relaxing 1H transitions with an optimal angle α, followed by selection of the slow-relaxing 13C transitions before t1. In panels (B) and (D) black solid curves show intensities originating from the slow-relaxing 1H and 13C transitions of the sum of the I = 3/2 and I = 1/2 manifolds, while the dashed black curves show the total signal intensity from all 1H transitions (including the fast-relaxing ones shown in blue). All calculations were performed in the absence of relaxation.
